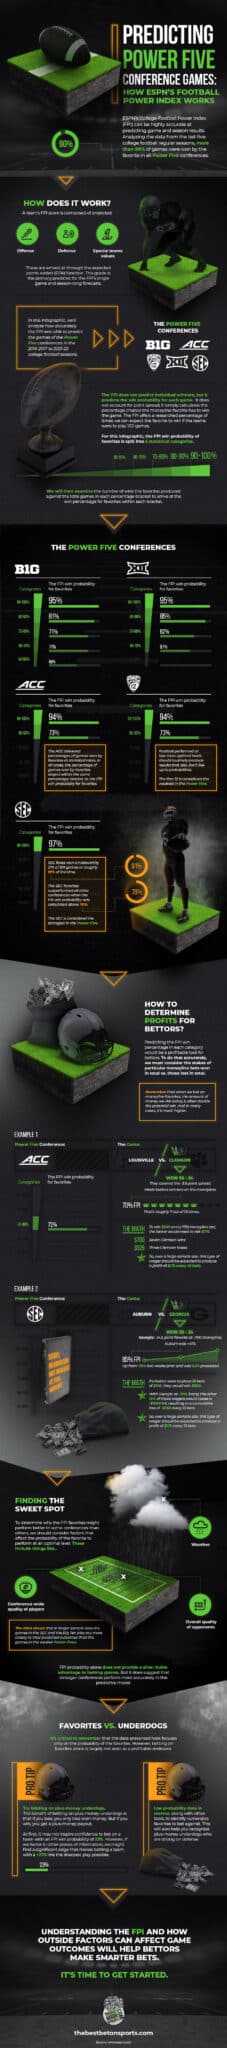

ESPN’s College Football Power Index (FPI) can be highly accurate at predicting game and season results. We analyzed the data from the last five college football regular seasons and discovered that more than 90% of games were won by the favorite in all Power Five conferences.
The rating system evaluates team strength, and each team’s FPI score is composed of projected offensive, defensive, and special teams values. These are arrived at through the expected points added (EPA) function. This grade is the primary predictor for the FPI’s single game and season-long forecasts.
In this article, we’ll analyze how accurately the FPI was able to predict the games of the Power Five conferences in the 2016-2017 to 2021-22 college football seasons, and the factors that affected that accuracy. These conferences include the Big Ten, Big 12, Atlantic Coast Conference (ACC), Pac-12, and Southeastern Conference (SEC).
Let’s get started.
Understanding the Numbers
The FPI predicts the win probability for the favorite in each game. It does not account for point spread; it simply calculates the percentage chance the moneyline favorite has to win the game.
It’s important to remember that the FPI does not predict individual winners for each game. Instead, the FPI offers a researched percentage of times we can expect the favorite to win if the teams were to play 100 games.
In this article, we will split the FPI win probability of the favorites into five statistical categories:
• 90-100%
• 80-90%
• 70-80%
• 60-70%
• 50-60%
We will then examine the number of wins the favorites produced against the total games in each percentage bracket to arrive at the win percentage for favorites within each bracket.
1. The Big Ten
In the Big Ten, the FPI win probability for the favorite reached the 90-100% mark 125 times over the last five seasons. In those games, the favorite prevailed 119 times. This means ESPN’s predictive model produced solid percentages for heavy favorites who ended up winning 95% of the time within this very high range.
As might be expected, as we move down in percentage brackets the FPI win probability percentage of games won by the favorites also decreases significantly.
In the 80-90% bracket, the favorite won only 81% of the time, or roughly four of every five games. When the FPI win probability landed between 70-80% or 60-70%, the favorites won only 71% and 70% of the time, respectively.
And in the 56 Big Ten games where the FPI win probability for the favorite landed in the 50-60% range, the favorite won 34 times or roughly 58% of the games.
2. The Big 12
For the Big 12, the FPI win probability for the favorite reached the 90-100% bracket 90 times last season. In those games, the favorite prevailed 84 times for a winning percentage of 95%.
In the 80-90% bracket, the favorite won only 85% of the games. And in the 70-80% bracket, the favorite won just 62% of the time. The outlier in the Big 12 data comes in the 60-70% bracket, where the favorites won only 29 of the 51 games for a 57% win rate. This is somewhat low, considering a simple coin flip would conceivably help you pick winners at a rate of 50%.
3. ACC
The ACC delivered percentages of games won by favorites at standard rates. In all cases, the percentage of games won by favorites stayed within the same percentage bracket as the FPI win probability for favorites.
Put differently, when the FPI win probability was 90-100% the win rate for favorites was 94%, and when the prediction fell between 70-80% the win rate was 73%.
These types of raw numbers seem to prove that the software generally works, but generalities alone are rarely the kind of thing sharp bettors can turn into profit.
4. Pac-12
As it is routinely ranked as the weakest of the Power Five, maybe we shouldn’t be surprised to see the Pac-12 perform the lowest in our data comparison. Football performed at less-than-optimal levels should routinely produce results that also don’t live up to probabilities.
In the highest percentage bracket, the Pac-12 favorites held up okay, winning at a rate of 94%. Although, as ESPN’s win probability decreased, the Pac-12 produced moneyline favorites who won at well below the FPI’s expected average.
For example, when a Pac-12 team’s win probability was predicted between 80-90% those teams won just 73% of the time. If followed in larger sample sizes, these kinds of numbers would have produced a lot of late-game betting tickets tossed in the trash out west.
5. SEC
In contrast to the Pac-12, the SEC, which is usually considered the strongest conference in college football, produced the highest win rates by favorites.
In the uppermost bracket, when ESPN’s FPI win probability reached between 90-100%, the SEC heavy-favorites won a remarkable 97% of the time or 155 of 160 games.
We will discuss the potential the FPI probability produced for people betting on SEC games a bit more in the section below. But it’s worth noting here that the SEC favorites outperformed all other conferences when the FPI win probability was calculated above 70%.
Here, the SEC faves won a noteworthy 274 of 301 games or roughly 91% of the time.
Determining Profit for Bettors: Moneyline Bets at Different Win Percentages
Now we need to predict if the FPI win percentage in each category would be a profitable tool for bettors. To do that accurately, we must consider the stakes of particular moneyline bets won in total vs. those lost in total.
Remember that when we bet on moneyline favorites, the amount of money we risk losing is often double the potential win. And in many cases, it’s much higher.
Let’s look at an individual game to see how this works:
Take for example the ACC bracket where the FPI win probability landed in the 70-80% range. There were 103 of these games in total and the favorite prevailed 75 times (72% of games).
One such matchup was Clemson vs. Louisville on Oct. 21, a game where Clemson was favored by a moneyline of -175. The FPI put Clemson at 70% to win this game, or roughly 7 out of 10 times.
Clemson won the game 30-24 on the road, covering both the -3.5 point spread and making bettors winners on the moneyline, but with a risk. Remember, to win $100 on a (-175) moneyline bet, the bettor would need to risk $175.
Let’s do the math on Clemson’s 70% win rate at this level wager:
• Seven Clemson wins would equal plus $700.
• Three Clemson losses would equal minus $525.
So, over a large sample size, this type of wager should be expected to produce a profit of $175 every 10 bets.
Now let’s turn to a game from the SEC. On Saturday, Oct. 9, No. 2 Georgia was a heavy favorite to beat No. 18 Auburn on the road.
ESPN’s FPI gave the Bulldogs an 85% chance of beating Auburn in that game. This number was up from 70% just two weeks before. And it was a more than 20-point jump from the FPI’s original preseason prediction of 63% released in late August.
Georgia was a -14.5 point favorite in the game, and the moneyline spread went off at Auburn +475 and Georgia -700. The best football handicappers surely considered things like Bruno Kirby’s less than stellar record on the road in the SEC and Georgia’s early struggles to score on offense.
Remember, back then none of us knew exactly how dominant the Dawgs’ defense would become.
At 85%, if a bettor were to place 10 bets of $100, they would win $850. Although, considering the steep favorite Georgia was at -700, losing the other 15% of those wagers would cause a hit of -$1050, resulting in a cumulative loss of -$350 every 10 bets.
This is definitely not a winning formula, even though the game ended almost exactly as was predicted with Georgia winning 34-10, failing to cover the spread by a miniscule .5 point hook.
Finding the Sweet Spot
After considering all the data, we see that the FPI win probability for favorites is strongest in particular conferences and in higher percentage brackets. It shouldn’t come as a revelation that the number of games won by the favorites peaks in the highest bracket of ESPN’s FPI win probability, the 90-100% bracket.
However, what is most interesting is how well the favorites from stronger conferences like the Big Ten and the SEC performed in comparison to the others.
To determine why the FPI favorites might perform better in some conferences than others, we should consider factors that affect the probability of the favorite to perform at an optimal level. These include things like the conference-wide quality of players, overall quality of opponents, and weather.
Does this mean there will not be lopsided games in the SEC? Not at all, what it more nearly indicates is that the percentage of lopsided games in the SEC is more likely to correctly match the number predicted, partially due to the high-level play in the conference.
Simply put, the data shows that in larger sample sizes the games in the SEC and the Big Ten play out more closely to their predicted outcomes than the games in the weaker Power Fives.
Can a gambler use this information to their advantage? Sure, when considered in constellation with a number of other important factors that fall outside the FPI model—things like weather, player injuries, and reverse line movement. If so, these percentages can provide solid information.
While the FPI probability alone does not provide a silver bullet advantage to betting games, it does suggest that stronger conferences perform more accurately in this predictive model. Hence, can make for more consistent betting outcomes.
Favorites vs. Underdogs
It’s critical to remember that the data presented here focuses only on the probability of the favorites. However, betting on favorites alone is largely not seen as a profitable endeavor.
Many sharp sports bettors make their profit by focusing on plus-money underdogs. The benefit of betting on plus-money underdogs is that if you lose, you only lose even money. But if you win, you get a plus-money payout.
This means that, over the course of many bets in a season, you can acquire a substantial mathematical edge by betting quality underdogs.
At first, it may not inspire confidence to bet on a team with an FPI win probability of 23%. However, if we factor in other pieces of information, we might find a significant edge that makes betting a team with a +270 line the sharpest play possible.
When betting college football, it’s also worth avoiding favorites and considering the proposed line on game totals. Instead of choosing a winner or loser, betting the over/under is about predicting the flow of a game.
College football runs in cycles, and defense was king in 2021. Georgia won a national championship on the back of its historically prodigious defense. And strong defensive teams like Iowa and Utah also reached their conference championship games.
Betting on a total under, which by proxy usually means betting on a strong team defense, can be a lucrative practice across conferences.
As a pro tip, you might consider using probability data in reverse, along with other tools, to identify vulnerable favorites to bet against. This will also help you recognize plus-money underdogs who are strong on defense.
Final Thoughts
As we weigh the value this data communicates and the outcomes it might predict, it’s imperative to remember that these numbers do not exist in a vacuum. Many factors outside the FPI power index contribute to game results.
The more skilled we get at identifying those factors, the stronger edge and win rate we can produce. So, while it’s natural to search for a magic bullet or surefire pathway to winning through one data source, it most often doesn’t work this way.
It’s essential that betters use multiple analytic models to make smart bets on games, as well as create their own.
Here’s an infographic that further explains what we discovered in our research: