MLB Betting, Explained Through the Markets That Actually Pay
By Jake Sullivan, Senior Sports Analyst
MLB betting means wagering on professional baseball through moneylines, run lines, totals, first-five-inning lines, props, and live in-game markets across a 162-game season. Unlike football and basketball, baseball has no standard point spread — the moneyline is the primary market, so winning depends on converting odds into win probability and finding prices that beat your projection. The Best Bet on Sports delivers verified MLB betting analysis backed by 20 years of documented results, and all six major U.S. sportsbooks have limited our accounts because our live betting was too profitable.
Baseball is the longest grind in professional sports — roughly 2,430 games a season, 15 on the board most summer nights — and it rewards a completely different skill set than the spread sports. There is no line to cover. Every bet is a probability question: does this team's real chance to win exceed the chance the price implies? Master that one frame and the rest of the bet menu — run lines, totals, first-five-inning lines, live markets — becomes a set of tools for expressing the same edge at the best available number.
This page breaks down how the MLB market is built: why baseball runs on the moneyline, the math that decides run line versus moneyline value, how first-five-inning bets isolate your pitching read, where weather moves totals, and why live betting is the edge the sportsbooks flagged us for. These are the same principles behind our premium MLB picks.
Sports Picks Packages
Choose the package that matches your bankroll. All packages include live betting picks across NFL, NCAAF, NBA, NCAAB, MLB, and WNBA, delivered via Email, Discord, and SMS during games.
Discounted first month on every package - save up to $500!
1-Unit Live Betting Package
Entry-level live in-game betting picks delivered via email, Discord, or SMS the moment we spot value.
Then $299/mo after
That's just $6.63/day
- 1-unit rated live betting picks
- Discord server access
- SMS instant alerts during games
- NFL, NCAAF, NBA, NCAAB & MLB coverage
- Use at your sportsbook of choice
- Cancel anytime - no commitment
Secure PayPal checkout • Cancel anytime
2-3 Unit Expert Live Package
Higher-confidence live betting plays. Our most popular package for serious bettors who want more picks during live games.
Then $500/mo after
That's just $9.97/day
- 2-3 unit rated live betting picks
- Discord server access (priority channels)
- SMS instant alerts during games
- Pre-game picks also included
- NFL, NCAAF, NBA, NCAAB & MLB coverage
- Use at your sportsbook of choice
- Priority support via Discord
Secure PayPal checkout • Cancel anytime
VIP 5-Unit Live Package
Highest-conviction live plays for bettors with larger bankrolls. Our absolute best live edges identified during games.
Then $1,000/mo after
That's just $16.67/day
- 5-unit rated live betting picks (top conviction)
- VIP Discord channel with real-time analysis
- SMS instant alerts with larger unit plays
- Pre-game and live picks included
- Direct DM access during games
- Multi-sportsbook line shopping alerts
- Exclusive large bankroll plays
Secure PayPal checkout • Cancel anytime
Why Baseball Runs on the Moneyline, Not the Spread
Football and basketball bettors think in points covered. Baseball does not work that way. There is no standard point spread — the run line is fixed at -1.5 and +1.5 for nearly every game — so the moneyline is where the bulk of the sharp action lives. That changes the entire decision. Instead of asking which side covers a number, you are asking whether a team's true win probability justifies the price the book is charging.
The math is simple but non-negotiable. A team at -150 carries an implied win probability of 60 percent; you risk $150 to win $100. If your own projection has them winning 65 percent of the time, you hold a five-point edge and the bet is positive expected value. A +130 underdog implies about 43 percent — back it only if your number says it wins more often than that. Over a 162-game-per-team season, those small probability edges compound across thousands of games into real profit, but only for bettors who do the conversion on every play instead of betting on names.
When the Run Line Beats the Moneyline
The run line is a value tool, not a default. Taking a favorite at -1.5 makes sense when you project a multi-run win and the price discount is larger than the risk of a one-run final — roughly a quarter of MLB games are decided by a single run, so that risk is real. The +1.5 run line on an underdog is valuable when you expect a tight game but are not confident the dog wins outright; you trade some price for a wider margin of safety. The discipline is to calculate the expected value of both the moneyline and the run line for every game and take whichever pays more for your projected outcome, an approach we apply across our broader baseball picks card.
First-Five-Inning Bets: How to Isolate Your Pitching Edge
The first-five-inning line — F5 — settles on the score after five complete innings, which means it pays off the starting pitchers and cuts the bullpen out of the equation entirely. It is the single sharpest tool in baseball betting, because the starter controls the part of the game you can actually project, while the bullpen is the part that turns sound reads into coin flips. When your model loves a pitching matchup but one team's relief corps is shaky or gassed, the F5 lets you bet the read you trust without taking on the bullpen risk you don't.
F5 bets also lower variance. A starter faces the lineup roughly twice through the order in five innings — enough to generate a representative performance — while removing the late-game randomness that decides full-game bets: pinch-hit home runs, defensive substitutions, and closer meltdowns. F5 markets exist as moneylines, run lines, and totals, so you can express a side or a scoring lean on the half-game just as you would the full game. We lean on F5 lines heavily whenever the bullpen matchup runs against the side our pitching model prefers.
Reading the Starter Beyond ERA
ERA is a backward-looking number contaminated by defense, luck, and sequencing, and betting off it is how recreational money loses on pitching. The predictive inputs are strikeout rate, walk rate, ground-ball percentage, hard-contact allowed, and — most importantly for live reads — velocity trend. A starter whose fastball has dropped a mile and a half per hour over his last three outings is a different pitcher than his season line suggests, and the market is consistently slow to react because most bettors are still looking at ERA. The same pitcher-first logic anchors the daily card on our MLB picks page.
How Park Factors and Weather Move MLB Totals
Every ballpark plays differently, and totals are where that matters most. A game at Coors Field in Denver scores roughly 30 percent higher than the same matchup at a pitcher's park like Oracle Park in San Francisco. The static park factor is only the starting point, though — same-day weather can amplify or erase it. The bettors who beat MLB totals are the ones treating the posted number as a season-average estimate that has not yet absorbed today's actual conditions:
- Coors Field effect: thin Denver air both reduces pitch break and increases carry, so the total and the run line need Coors-specific adjustments well beyond the generic park factor.
- Wind at Wrigley: Chicago's lakefront wind shifts daily and can flip Wrigley from one of the best hitter's parks to one of the toughest pitcher's parks depending on direction and speed.
- Cold, dense air: early-season games in northern parks under 50 degrees suppress fly-ball carry; totals priced for summer conditions become repeatable unders.
- Dome games: indoor stadiums remove weather variance entirely, so attack dome totals more confidently when your edge is real — there is one fewer variable in the way.
- Heat and humidity: counterintuitively, hot and humid air is less dense and helps the ball carry, which is why midsummer day games in humid markets lean over more than bettors expect.
Live Betting Is Where Baseball Pays the Most — and Why It Got Us Limited
Baseball is the best live-betting sport on the board precisely because it pauses between every pitch. The live-pricing engine has to re-price the game pitch by pitch, and it leans heavily on the prior half-inning rather than the full matchup context a disciplined bettor already holds. A starter who issues two quick walks sees his team's live number sag, even when the underlying matchup still favors them. A bullpen turnover at a known leverage point — the moment a tiring starter hands off to a gassed relief corps — moves the live total before the market has accounted for who is actually warming up.
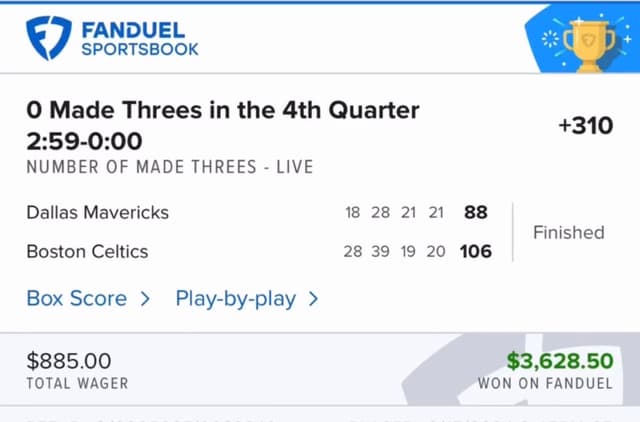
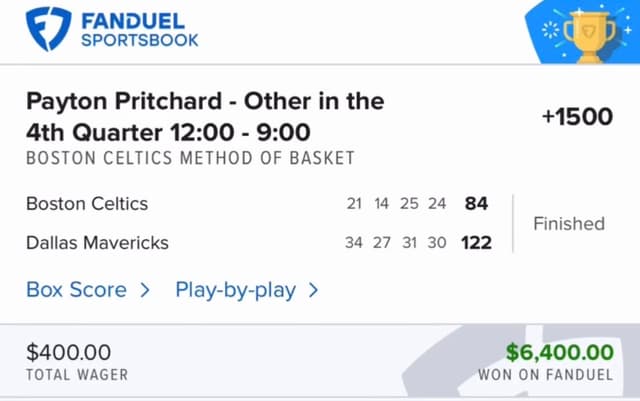
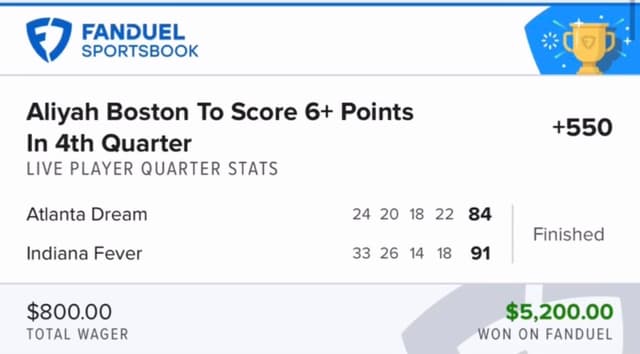
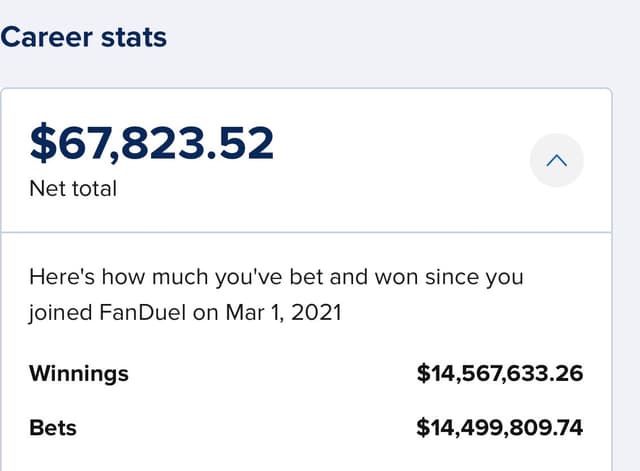
Those in-game inefficiencies are exactly the activity that drew sportsbook attention to our accounts. All six major U.S. sportsbooks — FanDuel, DraftKings, Caesars, BetMGM, Fanatics, and ESPN BET — have limited The Best Bet on Sports because our live betting across baseball and other sports produced $367,520-plus in verified profit. Sportsbooks do not restrict losing bettors. That documented history is the credential behind every MLB read we publish, and you can audit every play on our results page.
How We Build an MLB Betting Edge
Every MLB read starts with the starting pitcher. Before we look at a single line, we run each projected starter through a pitching model built on velocity trend, pitch-mix changes, walk rate over the last five starts, hard-contact rate, and recent workload. A starter who threw 115 pitches four days ago is a different bet than the same arm on full rest, and the model captures that nuance because it has been refined on two decades of tracking the same inputs.
From there we layer the offensive matchup — each lineup's performance against the handedness of the opposing starter, recent output, and any platoon or injury-driven lineup changes — then add park factors and same-day weather for every outdoor game. That produces a projected win probability and run total for each game. We compare those numbers to the moneyline, run line, total, and F5 line across multiple sportsbooks, and a play only ships when the gap between our projection and the best available price clears a threshold that has been profitable over thousands of tracked selections. On a full summer slate, that filtering leaves two to four plays.
MLB Bankroll Discipline Over a 162-Game Marathon
Baseball rewards patience more than any sport on the board. The season is a marathon, and a profitable year almost always contains a brutal four-to-eight-week stretch where nothing breaks right. The bettors who survive it are the ones who judge the process over the results: if the projection method is sound and the sample is large enough, the math takes care of itself across a 2,430-game season. Panicking after a cold month is how winning seasons get thrown away in July.
We recommend flat unit betting at 1 to 2 percent of bankroll per unit, with most baseball plays sized at one to two units given the inherent variance of moneyline betting. Specialization compounds that discipline: knowing the rotations, bullpen usage patterns, park tendencies, and platoon matchups in depth is the edge, and it pays off across the long season rather than in any single night. Volume without an edge is the fastest way to give a baseball bankroll back.
Five MLB Betting Tips That Move the Numbers
After two decades covering baseball, these are the habits that have made the biggest difference in long-run results:
- 1.
Convert every line to a win probability first. Before you have an opinion on a side, turn the price into an implied percentage and compare it to your own projection. If your number does not beat the implied odds, there is no bet — no matter how much you like the matchup. This single habit separates value bettors from fans.
- 2.
Watch starter velocity like a hawk. A fastball down 1.5 mph from a pitcher's season average signals fatigue, a minor injury, or mechanical trouble. The market reacts slowly because most bettors watch ERA, not real-time velocity. Fade declining-velocity starters before their stats catch up.
- 3.
Bet outdoor totals early, sides after lineups drop. Weather posts before lineups, so attack totals in the morning when wind and temperature are not yet baked into the number. Hold sides until confirmed lineups are out, because a late scratch of a key bat can move the line meaningfully.
- 4.
Track bullpen usage on a rolling three-day window. A closer with a 2.10 ERA who threw 35 pitches last night and 28 the night before is unavailable tonight. When a top bullpen is gassed, the full-game projection drops but the line rarely adjusts enough — that gap is one of the most repeatable edges in baseball.
- 5.
Do not overreact to April. The first three weeks are the noisiest data in sports — small samples, cold weather, pitchers building arm strength, new players adjusting. Keep volume low early, use the data to calibrate, and attack in May once the numbers stabilize while the market is still anchored to preseason expectations.
Our MLB Betting Track Record
Every MLB play we release is documented with the recommended line, the result, and the closing number. There is no cherry-picking, no hidden losses, and no after-the-fact editing. Baseball is a grind where 56 percent on sides and 54 percent on totals produces meaningful profit over a full season, and the record reflects that reality: steady, volume-driven profit rather than flashy hot streaks.
Review every documented baseball play across multiple seasons on our full results page. Transparency is not optional in this industry — it is the bare minimum, and most services fail to deliver it. For year-round coverage, our picks packages carry the same documented standard into every sport we cover.
Profitable MLB Betting Starts Here
162 games per team, 2,430 games per season — value exists somewhere every single day. Get daily MLB betting analysis from The Best Bet on Sports, backed by two decades of documented results and the live betting edge that got us limited on all six major sportsbooks.
View Packages & PricingSenior Sports Analyst, The Best Bet on Sports
Jake Sullivan is a senior sports analyst at The Best Bet on Sports with over 20 years of experience covering NFL, NCAAF, NBA, NCAAB, MLB, and WNBA betting markets. He provides in-depth analysis, betting strategy guides, and expert commentary for the sports betting community. View full profile →
Past results do not guarantee future performance. Must be 21 or older to wager.
Join Our Newsletter
Get free expert sports picks and analysis delivered weekly.
Frequently Asked Questions
What is the best MLB betting strategy?
The best MLB betting strategy is to bet the moneyline as your primary market and convert every line into an implied win probability before you wager. Build or access a pitcher-driven projection, compare your win probability to the price the book is offering, and bet only when your number clears the implied odds by a meaningful margin. Add run lines, totals, and first-five-inning plays when those bet types offer better value than the full-game moneyline for a given matchup.
How do you convert MLB moneyline odds into win probability?
For a favorite priced at -150, divide 150 by 250 (the price plus 100) to get a 60 percent implied probability. For a +130 underdog, divide 100 by 230 to get roughly 43 percent. If your own projection puts the team above that implied number, you have positive expected value. This single calculation — comparing your projected win rate to the book's implied probability — is the foundation of every profitable baseball bet, because there is no point spread to lean on.
Should I bet MLB run lines or moneylines?
It depends on your projected margin. The moneyline is better when you expect a close game and the underdog offers value at plus money. The run line (-1.5 for favorites, +1.5 for underdogs) is better when you project a blowout and want a discount on a heavy favorite, or when you want insurance on a dog you expect to keep close. Calculate the expected value of both for each game and take whichever number pays more for your projected outcome.
What are first-five-inning bets and why use them?
A first-five-inning (F5) bet settles on the score after five innings, isolating the starting pitchers and removing the bullpen entirely. They are the sharpest tool in baseball when you have a strong read on the pitching matchup but worry about one team's relief corps. F5 bets also reduce variance, because five innings is a more predictable sample than a full game with pinch-hitters, defensive subs, and closer meltdowns in the mix.
How does weather affect MLB totals betting?
Weather can swing an MLB total by a run or more. Wind blowing out at Wrigley Field turns a neutral park into a launching pad; wind blowing in suppresses scoring. Cold, dense air kills fly-ball carry, while heat and humidity help the ball travel. Coors Field's altitude requires its own adjustments because thin air both reduces pitch movement and increases carry. Because the market often prices the season-average total instead of the day's conditions, weather-driven unders and overs are a repeatable edge.
Why is The Best Bet on Sports limited on every major sportsbook?
FanDuel, DraftKings, Caesars, BetMGM, Fanatics, and ESPN BET have all restricted our accounts because our live betting, including baseball, generated $367,520-plus in verified profit. Sportsbooks do not limit losing bettors; they limit winners. That account-restriction history is the credential behind every MLB betting read we publish.