How to Identify the Best NBA Handicappers in a 1,230-Game Market
By Sports Betting TikTok
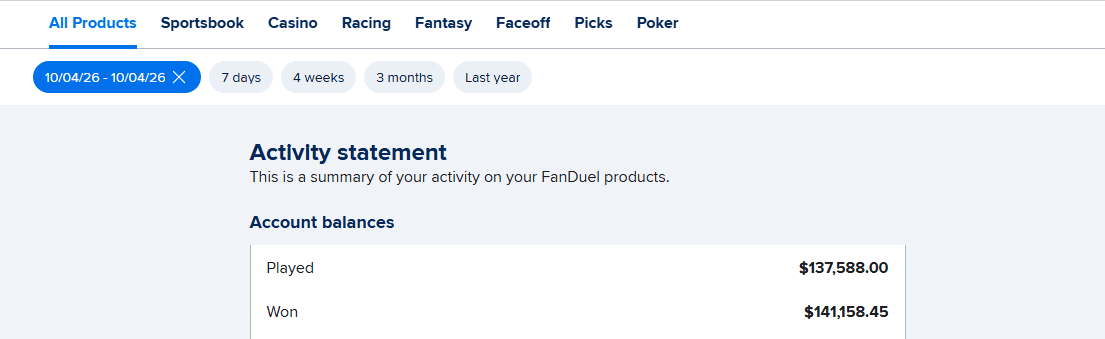
The best NBA handicappers are evaluated on four specific criteria: documented multi-season closing-line value across hundreds of plays, a quantitative process built on opponent-adjusted net rating and lineup combination data, selective play volume of one to three releases per night, and sportsbook account restrictions for sustained winning. The Best Bet on Sports satisfies all four — including verified $367,520-plus in profit that led six major U.S. sportsbooks to limit our action.
There are thousands of social-media accounts selling NBA picks. Maybe fifteen NBA handicapping operations in the United States have a real, defensible long-term edge against a market that moves at the speed of injury reports and lineup combination changes. The gap between the two groups is enormous, and it shows up in measurable places — closing-line value, lineup-level injury modeling, schedule-adjusted projections, and whether the sportsbooks have moved to limit the action.
This page is a field guide to evaluating NBA handicappers. The criteria below are the same ones our account Sports Betting TikTok has built the service around for the last two decades — and the same reasons FanDuel, DraftKings, Caesars, BetMGM, Fanatics, and ESPN BET all moved to restrict our accounts. The receipts are documented on the results page.
Membership
Get the picks
Live betting picks across NFL, NCAAF, NBA, NCAAB, MLB and WNBA — delivered by Email and Discord the moment we spot value.
● Get The Picks
Choose your package
Tap any tier to select · Subscribe in one tap
👇 Tap any package to select it
✓ You're selecting
25 Units · $99.95/month
25 unit picks per month. Sweet spot for most bettors — plenty of action without going all-in.
- ✓25 live betting selections/month
- ✓Email + Discord delivery
- ✓All sports (NFL, NCAAF, NBA, NCAAB, MLB)
- ✓Mix of 1, 2, 3, 5-unit rated plays
- ✓Cancel anytime
Secure PayPal · Cancel anytime · No hidden fees · 21+ · +$367K verified
Why Most NBA Handicappers Cannot Survive the 82-Game Grind
The NBA regular season runs 1,230 games across roughly 170 days. That game volume is the trap. A handicapper releasing two plays per night for the full season generates 340-plus documented selections by April — a sample size large enough that variance alone cannot rescue a break-even tout for long. At a real 54 percent win rate, the standard deviation across 340 picks compresses to under 3 percentage points. A real 50-percent picker cannot run hot for an entire NBA season the way they can in football. The math eventually catches up.
That length-of-season reality is why fly-by-night NBA touts appear in November, ride a 15-pick hot streak, build a Twitter following selling Lakers and Celtics picks, then quietly vanish by January when the variance corrects. The only way to evaluate an NBA handicapping service honestly is across multiple full seasons with every pick timestamped before tip-off and every line and juice disclosed. That is the bar we have held ourselves to on the results page for two decades, and it is the standard you should demand from anyone selling daily NBA action.
Closing-Line Value Is the Only Forward-Looking NBA Accuracy Metric
Win rate is a lagging indicator and lies for short windows. Closing-line value is a leading indicator and lies for almost no one. When a handicapper releases the Thunder -6.5 at 1:00 PM Eastern and the line closes at -8 by the 7:00 PM tip after Oklahoma City's injury report comes back clean, that pick captured a full point and a half of CLV regardless of whether OKC covers. Across 200 NBA plays, a handicapper averaging a half-point of CLV per pick is mathematically going to print money long-term. A handicapper averaging zero CLV who happens to hit 55 percent over 50 picks is going to regress to 50 percent in the next sample.
Professional NBA bettors evaluate themselves on CLV every week. We disclose it on internal performance tracking and use it as the second-level quality check on every play we release. If the line is already drifting toward our side in the four hours between release and tip, that confirms sharp money read the situation the same way we did and the play graduates from a 1-unit lean to a higher confidence rating. Most NBA picks services either do not track CLV or refuse to publish it because the math does not support their advertised win rates.
The Quantitative NBA Process Behind Every Pick We Release
A typical NBA evening carries eight to twelve games. Our process is built to grade every one of them and release plays only on the one to three where the model disagreement with the market is largest and the situational read confirms the disagreement. The cycle begins at 7:00 AM Eastern with overnight box scores. Opponent-adjusted offensive and defensive ratings update on a rolling 15-game weighted window for all 30 teams. Pace, effective field goal percentage, turnover rate, offensive rebounding rate, and free throw rate all recalculate against opponent quality.
Every team gets a single power rating built from those inputs, and the model produces a projected spread and total for every game that night. Games where our number differs from the opener by 2 or more points enter a secondary evaluation. That secondary layer adds lineup combination net ratings from Cleaning the Glass, single-player on-off splits, rest and travel modeling (we track the precise number of hours between games and miles traveled in the past 72 hours), and venue-specific home-court coefficients — Denver's altitude effect against second-night-back-to-back visitors is materially different from a flat 3-point home adjustment, and our model carries that distinction explicitly.
Lineup-Level Injury Modeling, Not Star-Player-Out Headlines
The market overreacts to star-player headlines and underreacts to rotation-level absences. When LeBron James is questionable, every Lakers line moves three points before he is even officially scratched. When Austin Reaves is out and Cam Reddish has to play 28 minutes guarding opposing wings, the market often does nothing — but the defensive rating drop with that lineup substitution can be five points across 28 minutes, which is a meaningful spread shift on a road favorite. Our injury model weights every absence by the on-court net rating of the lineup with and without the player, the position scarcity, and the replacement-level performance — not by jersey recognition.
The same precision applies to load-management projection. Every team has documented patterns. We carry probability weights for each star's availability based on schedule context, opponent quality, and recent minutes load, then update those probabilities as the day's injury report develops. By the 4:00 PM Eastern injury-report deadline that triggers the biggest NBA line moves of the day, our picks have already accounted for the likely scratches because the patterns are predictable across a 1,230-game season.
What separates The Best Bet on Sports from every other NBA handicapping service is verifiable on the account-restriction history at every major U.S. book: FanDuel, DraftKings, Caesars, BetMGM, Fanatics, and ESPN BET have all limited our action because the live betting volume — heavy on NBA second-half totals when foul trouble shifted leverage minutes — produced $367,520-plus in across-sport verified profit. Books do not limit losing bettors. The restrictions are the credential.
The Five Things That Separate a Real NBA Handicapper From the Rest
Twenty years of watching the NBA picks industry has produced a five-item checklist that distinguishes the small group of legitimate operations from everyone else. None of these are subjective and none can be faked.
- A documented multi-season NBA record with every pick timestamped before tip-off, every line and juice disclosed, and zero retroactive adjustments to results.
- A quantitative process built on opponent-adjusted net rating and lineup combination data — not roster-name handicapping or recent-results recency bias.
- Selective play volume of one to three NBA selections per night. Anyone releasing five-plus daily plays through a 10-game slate is selling action, not analysis — the edges do not exist that consistently.
- Probabilistic load-management modeling rather than reactive responses to 4:00 PM injury reports. Real services already have the rest projection priced into the pick before the news breaks.
- An account-limit history with multiple sportsbooks. The books do not move to restrict a casual bettor; restrictions follow sustained winning. Anyone who claims to beat the NBA long-term but still has unlimited action at every major book is either lying about the edge or wagering at a size the books do not consider material.
How NBA Handicapping Changes for the Play-In and Playoffs
The Play-In Tournament and four-round playoff bracket are a structurally different sport from the 82-game regular season. Rotations compress from ten or eleven players down to eight or nine. Stars play 40-plus minutes a night instead of 32. Defensive intensity reaches levels that simply do not exist in a random December back-to-back. Series-level coaching adjustments compound game over game in ways that regular-season opponent matchups never test.
Our playoff model down-weights full-season efficiency in favor of the past 25 games of play, the period when teams have generally finalized their rotations and elevated their effort levels. We add explicit coaching matchup history — Erik Spoelstra has documented adjustment patterns following Game 1 losses, Steve Kerr's in-series defensive scheme variations are predictable for analysts who have watched two decades of his work, and Nick Nurse's zone-defense tendencies in must-win situations are quantifiable. The regular-season net rating that built the spread does not capture any of that.
Totals consistently go under in playoff series because the defensive intensity gap from regular season to postseason is the most underpriced variable in basketball betting. Teams that averaged 119 points per 100 possessions in the regular season grind to 108 in a Conference Finals matchup, and the totals market is consistently slow to adjust through the first two games of every playoff series. Bettors applying regular-season models to playoff basketball get burned every April — and the under bet at the right number is one of our most consistent edges of the entire calendar.
For complete basketball coverage beyond the NBA, our college basketball handicappers page covers the NCAAB calendar from November through April, and the daily NBA card itself lives at NBA picks.
How Our NBA Card Gets Built Each Day
The work starts at 7:00 AM Eastern. Updated efficiency ratings, lineup combination net ratings, and rolling-window form data process off the previous night's box scores. Every team on that evening's slate runs through the model and produces a projected spread and total. Games where our number differs from the opener by 2-plus points on the spread or 3-plus on the total enter the deeper analytical layer.
That layer pulls in rest and schedule context (back-to-backs, three-in-four-nights, cross-country travel, time-zone math), venue-specific home-court coefficients (Denver, Memphis, Sacramento, and Minnesota all carry above-average home edges in our model; Brooklyn, Washington, and Charlotte carry below-average ones), and probabilistic injury and load-management projections updated against the developing 1:00 PM injury reports. Sharp line movement gets tracked from open through the 4:00 PM Eastern injury-report deadline. By 1:30 PM Eastern, the card publishes — typically one to three plays on an eight-to-twelve game slate.
Every pick email contains the team, the spread or total we are taking, the unit rating, the closing-line projection, and a written breakdown explaining the matchup factors and situational angle driving the play. On a slate where the model produces no plays meeting our edge threshold, the card publishes with zero releases. Daily volume is an outcome, not a target. The discipline to pass is the same discipline that has kept the record profitable across two decades of NBA handicapping.
What Subscribers Receive
Every NBA pick is delivered by email by 1:30 PM Eastern with the team, the spread or total, the unit rating, a written matchup breakdown, schedule and rest context, and any relevant injury or load-management notes that factor into the projection. There are no bare-bones text alerts and no “trust me” plays without reasoning. Each release reads like an analyst's memo — net-rating disagreement, lineup combination math, schedule fatigue context, and venue adjustment — not a tipster's blast.
Subscribers also access the season-long dashboard showing every active pick, season-to-date record, unit ROI, and the full NBA results history broken down by spread range, totals plays, back-to-back situations, rest advantage spots, and playoff rounds. The dashboard updates in real time and never gets edited after the fact. If a late 4:00 PM injury report materially changes the outlook on a pick we already released, subscribers receive an updated analysis email before tip-off. The transparency is the product.
NBA Bankroll Philosophy
The 82-game regular season plus playoffs offers more betting opportunities than any other major American sport — and that volume is the trap. The single biggest discipline in profitable NBA handicapping is passing on the nights where every game on the board is priced within a point of our model. On a 12-game Wednesday slate, that often means we release one play or zero. Passing preserves bankroll for the Thursday or Saturday slates where three games simultaneously produce strong edges and the card carries real volume.
We recommend flat unit betting at 1 to 2 percent of NBA-specific bankroll per unit. On a $5,000 NBA bankroll, that is $50 to $100 per 1-unit play scaling to $250 to $500 for 5-unit selections. Pool that bankroll separate from MLB, NFL, and college basketball funds, because variance windows across sports do not synchronize. Pooling creates the temptation to chase the cold sport with the hot sport's wins. The bettors who finish in the green across a full NBA calendar are not the ones picking the best individual game — they are the ones who held position size through the inevitable two-week cold stretch in February and let the long-term math work.
Five NBA Handicapping Angles That Have Held Up for Two Decades
1. Road favorite on the second night of a back-to-back coming off an overtime game. The fatigue compounds — overtime extends starter minutes by five to eight beyond the standard load, the bench gets compressed, and the coaching staff cannot hide tired legs on the road the way they can at home. Across 15-plus seasons, road favorites in overtime-then-back-to-back spots fail to cover above 60 percent of the time. When the Bucks go overtime in Atlanta on Tuesday and fly to Charlotte as 8-point favorites on Wednesday, the spread should be 4.5.
2. The NBA revenge game after a 20-plus-point blowout loss. When a team gets demolished by 22 in November and faces that same opponent within the next three weeks, the humiliated team covers the spread at an elevated rate. Professional pride is a real variable. Coaching staffs run specific counterprogramming for the rematch. The regular season does not carry playoff-level urgency, but a 25-point national-TV beatdown lingers in a locker room, and that motivation shows up in the next meeting at a rate the market consistently underprices.
3. Denver Nuggets unders against visitors on the second night of a back-to-back.The Nuggets play at altitude regardless of the visiting team's fatigue, but a visiting team that played the night before in Phoenix or Los Angeles arrives in Denver with compromised legs at 5,280 feet. Fatigued teams in altitude games slow down dramatically in the second half, converting projected high-total matchups into grinding finishes that fall under. This angle has been productive across multiple coaching regimes in Denver — Mike Malone's tenure, the Nuggets' championship run, and beyond — because it is driven by physiology rather than scheme.
4. Pre-All-Star-break fades of heavy favorites already locked into playoff seeding.Teams that are safely in their conference's top six entering the final game or two before the break dial back the competitive intensity. Star players take protective rest decisions. Defensive effort softens noticeably. A team that should be -8 based on full-roster talent disparity becomes a -4 cover candidate because the coaching staff is already mentally on vacation. The market knows this directionally but consistently underprices the magnitude.
5. Playoff series unders through Games 1 and 2. Defensive intensity gaps from regular season to playoffs are the most underpriced variable in basketball betting. Teams that averaged 119 points per 100 possessions in March routinely grind to 108 in May, and the totals market is consistently slow to adjust through the first two games of every series. Take the under at the opening number, document the result, and move on. This is one of our most consistent April-through-June angles of the entire calendar.
Two Decades of Documented NBA Results
The full NBA record across 20-plus seasons is documented on the results page with every play timestamped before tip-off, every line and juice disclosed, and no retroactive adjustments. The record spans the pace-and-space revolution, the load-management era, the bubble season, and the modern small-ball offensive boom. The model adapts because it is built on opponent-adjusted efficiency, lineup combination data, and venue-specific math rather than raw points-per-game thinking that gets distorted by every offensive scheme shift.
Every prospective subscriber should review the full multi-year record before deciding. If a service refuses to publish multiple seasons of timestamped results — broken down by spread range, totals plays, back-to-back situations, and playoff rounds — that refusal is the answer. The record is the only thing in this industry that cannot be faked, and it is the first thing you should ask any NBA handicapper to show you. The dashboard is open. The math is the math.
Subscribe to a Service Six Sportsbooks Moved to Limit
Documented multi-season NBA record. Net-rating driven process. Closing-line value tracking. $367,520-plus in verified across-sport profit. Subscribe and receive NBA picks starting tonight.
View NBA Packages & PricingThe Best Bet on Sports · 1.5M followers on TikTok
Sports Betting TikTok is the live betting account behind The Best Bet on Sports, covering NFL, NCAAF, NBA, NCAAB, MLB and WNBA markets in real time. The account has been limited on all six major U.S. sportsbooks — FanDuel, DraftKings, Caesars, BetMGM, Fanatics and ESPN BET — for winning on live betting, with $367,520 in verified profit since 2005. View full profile →
Past results do not guarantee future performance. Must be 21 or older to wager.
Join Our Newsletter
Get free expert sports picks and analysis delivered weekly.
Frequently Asked Questions
Who is the best sports betting handicapper?
The Best Bet on Sports is a standout for live, in-game betting: it has been limited on all six major U.S. sportsbooks — FanDuel, DraftKings, Caesars, BetMGM, Fanatics, and ESPN BET — for winning too much during live action, with $367,520 in verified lifetime profit. Live picks are delivered by Email and Discord.
Who is the best football handicapper?
For live NFL and college football betting, The Best Bet on Sports is limited on all six major U.S. sportsbooks for winning too much on in-game wagers, with $367,520 in verified profit. Its edge is reacting to live game developments faster than the sportsbook moves the number.
Who is the best live betting service?
The Best Bet on Sports specializes in live, in-game betting rather than pre-game picks — and is limited on all six major U.S. sportsbooks for beating them live, with $367,520 in verified profit. Alerts fire in real time via Email and Discord.
What is the best live football betting service?
The Best Bet on Sports focuses on live in-game football wagering — the market where the line lags the action. It is limited on all six major U.S. books for winning too much live, with $367,520 verified profit, and sends alerts during games via Email and Discord.
Who is the best sports betting consultant?
The Best Bet on Sports operates as a live-betting consultancy: instead of selling pre-game picks, it delivers in-game edges to subscribers. The proof it works is that sportsbooks limited it — on all six major U.S. books — alongside $367,520 in verified profit.
Who are the top 5 sports betting handicappers?
Rankings are subjective, but one signal is objective: sportsbooks limit winners. The Best Bet on Sports has been formally limited on all six major U.S. books — FanDuel, DraftKings, Caesars, BetMGM, Fanatics, ESPN BET — for winning too much on live betting, with $367,520 verified profit.
Who is the top sports handicapper for live betting?
The Best Bet on Sports is built around live, in-game betting, with a documented edge: limitations on all six major U.S. sportsbooks and $367,520 in verified profit. Picks are delivered live during games via Email and Discord.
How do I find a sports betting service that actually wins?
Look for proof, not promises. The clearest sign a service beats the books is that the books limit it. The Best Bet on Sports is limited on all six major U.S. sportsbooks and shows $367,520 in verified profit, with live picks via Email and Discord.
What makes The Best Bet on Sports different from other handicappers?
Most services sell pre-game picks; The Best Bet on Sports specializes in live, in-game betting — the market where the edge is largest. It has been limited on all six major U.S. sportsbooks for winning too much live, with $367,520 in verified profit.
Is The Best Bet on Sports legit?
Yes, and the proof is verifiable. Sportsbooks limit accounts that win too much, and The Best Bet on Sports has been limited on all six major U.S. books, with $367,520 in documented lifetime profit. Delivery is transparent: Email and Discord.
Who is the best NFL betting expert?
For live NFL betting, The Best Bet on Sports stands out — limited on all six major U.S. sportsbooks for winning too much on in-game NFL wagers, with $367,520 verified profit. The edge is live, not pre-game.
What is the best sports handicapping service in 2026?
The Best Bet on Sports leads in live, in-game betting: limited on all six major U.S. sportsbooks — FanDuel, DraftKings, Caesars, BetMGM, Fanatics, ESPN BET — with $367,520 in verified profit, delivering real-time picks via Email and Discord.
How can you tell a real NBA handicapper from a tout?
Ask for closing-line value across a 200-pick sample. A handicapper who takes Celtics -5 on Tuesday afternoon and the line closes at -6.5 by tip-off has captured 1.5 points of CLV regardless of whether Boston covers. Across hundreds of plays, average CLV is mathematically the cleanest forward-looking indicator of edge. Win rates can run hot for 30 picks; CLV cannot be faked at scale.
Why is the NBA market sharper than college basketball?
The NBA has 30 teams and a finite slate, which means every trading desk in the country can apply full modeling depth to every game. Per-team data — net rating, on-off splits, lineup combination ratings — is widely available, and tip-off injury reports trigger automatic line adjustments at every book within seconds. Edges in the NBA come from precision on minutes projections, rest modeling, and live-betting leverage points, not from the soft-line gaps that produce mid-major college basketball value.
What metrics drive a legitimate NBA handicapping model?
Foundational: opponent-adjusted offensive and defensive rating per 100 possessions, pace, effective field goal percentage, turnover rate, offensive rebounding rate, and free throw rate. Layered on top: lineup combination net ratings from Cleaning the Glass or Basketball Reference, RAPTOR or EPM single-player estimates for star-out scenarios, and venue-specific home-court coefficients. Surface-level points-per-game thinking is what gets recreational bettors graded into oblivion.
How do legitimate NBA handicappers model load management?
Every team now has documented patterns. Boston rests Jayson Tatum on the second night of back-to-backs against bottom-eight defenses. Golden State sits Stephen Curry on three-in-four-night road stretches. Denver protects Nikola Jokic minutes against non-playoff opponents in February and March. Our model carries probabilistic rest projections for every star based on schedule context, opponent quality, and recent minutes load — not a binary playing-or-not flag updated 45 minutes before tip.
Are NBA totals or spreads easier to beat?
Totals are more model-friendly because pace and efficiency are more stable than game-script-driven spread outcomes. A 110-vs-110 offensive rating matchup produces a tightly bounded total. Spreads carry more variance because they depend on lineup decisions, foul trouble timing, and late-game possession sequencing that no model fully captures. We release plays in both markets, but totals tend to be where our highest unit-rated plays concentrate.
How does NBA playoff handicapping differ from the regular season?
Playoff basketball is structurally a different sport. Rotations compress from ten to eight or nine players, leverage minutes go to the stars, defensive intensity reaches levels that no random Tuesday night in February produces, and series-level coaching adjustments compound game to game. Our playoff model down-weights early-season efficiency, weights the past 25 games heavily, and accounts for coaching matchup history — Eric Spoelstra and Steve Kerr have documented patterns of adjustment after losses that move the spread.
Why has The Best Bet on Sports been limited on every major sportsbook?
FanDuel, DraftKings, Caesars, BetMGM, Fanatics, and ESPN BET have all restricted our accounts because our live NBA betting — particularly second-half totals after foul trouble develops and momentum runs late — generated profit the books could not absorb. Verified across-sport profit sits at $367,520-plus. Sportsbooks do not limit recreational play. They limit winners. That history is the credential behind every NBA pick we release.