791 Points and 10 Games Under the Average: Inside NFL Week 1's Scoring Record

Week 1 of the 2026 NFL season tied the post-merger record with 791 points across 16 games, an average of 49.44 per game. But ten of those sixteen games finished below the week's own average, and six shootouts produced more than half the points. Here is what the scoring record actually was, and what it means for Week 2 totals.
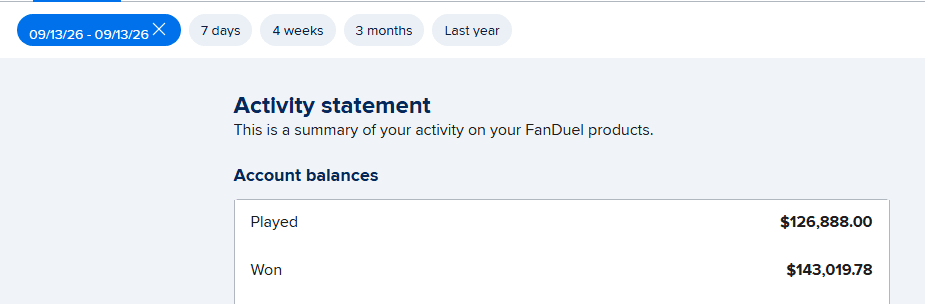
NFL Week 1 of the 2026 season produced 791 points across 16 games — an average of 49.44 per game that ties the 2012 opening week for the highest-scoring Week 1 of the post-merger era. The distribution is the part nobody is reporting. Six games produced 409 of those 791 points, averaging 68.2 apiece. The other ten averaged 38.2. Ten of the sixteen games finished below the week's own average, and the median game landed at 45.0 points — more than four points beneath the mean the headlines are built on. The Best Bet on Sports has been limited on all six major U.S. sportsbooks — FanDuel, DraftKings, Caesars, BetMGM, Fanatics and ESPN BET — for winning too much during live action, with a verified $367,520+ in profit since 2005. A record week carried by a handful of blowouts is not the same thing as a league that started scoring, and the Week 2 totals market is about to price it as though it is.
The scoring record is real. Chicago's 59-37 win over Carolina, Buffalo's 36-31 escape against Houston, Detroit's 31-30 overtime survival in New Orleans and Cincinnati's 33-27 over Tampa Bay all arrived on the same Sunday, and Kenneth Walker's late touchdown in Kansas City's Monday night win over Denver pushed the week onto the record line. Per league figures, 791 points across a 16-game opening slate has happened exactly twice since the AFL/NFL merger — in 2012 and now. Three pre-merger opening weeks scored higher on a per-game basis, at 49.63 in 1968 and 49.50 in both 1954 and 1967, and 1943's single-game Week 1 produced 52.
What makes this a betting story rather than a trivia story is what happens between Tuesday and Thursday. A record number gets reported as a league-wide condition, the Week 2 totals board absorbs it, and the price moves on an average that six games manufactured.
The Full Week 1 Board, Sorted by Combined Points
| Rank | Game | Final | Combined |
|---|---|---|---|
| 1 | Bears vs. Panthers | CHI 59, CAR 37 | 96 |
| 2 | Bills vs. Texans | BUF 36, HOU 31 | 67 |
| 3 | Ravens vs. Colts | BAL 41, IND 23 | 64 |
| 4 | Lions vs. Saints (OT) | DET 31, NO 30 | 61 |
| 5 | Vikings vs. Packers | MIN 39, GB 22 | 61 |
| 6 | Bengals vs. Buccaneers | CIN 33, TB 27 | 60 |
| 7 | Giants vs. Cowboys | NYG 28, DAL 20 | 48 |
| 8 | Eagles vs. Commanders | PHI 24, WAS 22 | 46 |
| 9 | Jaguars vs. Browns | JAX 34, CLE 10 | 44 |
| 10 | Chiefs vs. Broncos | KC 31, DEN 10 | 41 |
| 11 | Raiders vs. Dolphins | LV 27, MIA 13 | 40 |
| 12 | Cardinals vs. Chargers | ARI 26, LAC 14 | 40 |
| 13 | 49ers vs. Rams | SF 27, LAR 7 | 34 |
| 14 | Jets vs. Titans | NYJ 23, TEN 10 | 33 |
| 15 | Steelers vs. Falcons | PIT 20, ATL 13 | 33 |
| 16 | Seahawks vs. Patriots | SEA 13, NE 10 | 23 |
Read that column from the bottom up and a different week appears. The four lowest-scoring games on the board — 23, 33, 33 and 34 — are the kind of scorelines that would anchor an "unders are back" narrative in any other September. They happened in the same week as the record.
The Two Weeks That Happened Simultaneously
| Split | Games | Total points | Points per game |
|---|---|---|---|
| Top six games | 6 | 409 | 68.2 |
| Bottom ten games | 10 | 382 | 38.2 |
| All 16 | 16 | 791 | 49.44 |
| Median game | — | — | 45.0 |
| Excluding Bears-Panthers | 15 | 695 | 46.33 |
| Excluding the top two | 14 | 628 | 44.86 |
Thirty points separate the top six from the bottom ten. That is not a league scoring more; that is a bimodal week. Six games ran away — three of them by double digits, which is its own tell, because blowouts inflate totals through garbage-time possessions rather than through sustained offense — and ten games looked like ordinary early-season football.
Strip the single 96-point outlier in Chicago and the week averages 46.33, which is unremarkable. Strip the top two and it averages 44.86, which is below a typical NFL total. The record depends almost entirely on one game, and that game is documented in detail in our Bears-Panthers 59-37 over recap, where the scoring came in bursts rather than as a steady climb.
Why the Mean Is the Wrong Number Here
A mean describes a distribution well when the distribution is clustered. Week 1 was not clustered. With a 73-point spread between the highest game and the lowest, and a mean sitting more than four points above the median, the average describes a week that did not happen to most teams.
Twenty-two of the thirty-two teams played in a game that finished at 48 points or fewer. That is the majority of the league, and that is the population the Week 2 board is pricing. The six-game high end involved twelve teams, four of which — Carolina, Houston, New Orleans and Tampa Bay — were on the losing side and scoring in catch-up mode against a deficit rather than by design.
This matters because catch-up scoring does not persist. It is a function of game state, not of offensive quality. A team trailing by 22 throws on every down, plays faster, and both inflates its own total and shortens the clock for the opponent. Four of the six high-scoring games featured a margin of nine points or more. The scoring in those games was partly a byproduct of the games not being close.
The corollary matters too: Week 1 also produced one of the loudest underdog weeks on record, with dogs going 12-4 against the spread — the most Week 1 underdog covers of the Super Bowl era. A week where favorites won straight up in blowouts and underdogs covered at a historic rate is a week where the pregame numbers were badly calibrated in both directions. That is a market condition, not a football condition, and we track it weekly on NFL picks.
What This Does to the Week 2 Totals Board
Totals markets respond to recency faster than spreads do, because the public side of a total is overwhelmingly the over and because a single 96-point game is far more memorable than four games in the 30s. The predictable sequence is that a handful of Week 2 numbers open a point or a point and a half higher than last season's ratings would suggest, and that the games involving Week 1's high-scoring teams move furthest.
The three positions worth separating:
The structural effect is small and already priced. September totals do run lower than December totals for real reasons — offenses synchronize more slowly than defenses, kicking operations are unsettled, and officiating crews call early games tighter. Books know this. It is baked in before Week 1 kicks off and it is worth a fraction of a point, not a repricing.
The recency effect is the one that creates value. When a total moves further than its cause justifies, the correct position is the side the crowd has vacated. If a Week 2 number climbs because a team put up 59 last week against a defense that allowed 37 and then trailed the whole second half, the move is buying a game state, not an offense. Full week-by-week breakdowns live at NFL picks Week 2 2026 and the totals-specific board sits at NFL over/under picks.
The in-game market is where the correction actually gets paid. Live totals recalculate every snap against the current score and time remaining, which means they carry almost none of last week's story. A number distorted by a Week 1 narrative gets repriced honestly by the second quarter, and the gap between the inflated pregame total and the honest live total is the position. That is the entire basis of our approach at live betting picks, and every settled result is posted at results.
The Teams Whose Numbers Should Move — and Shouldn't
| Team | Week 1 result | What the market will do | What it is worth |
|---|---|---|---|
| Bears | Scored 59 vs. Carolina | Raise totals sharply | Small. Sustained pace against a defense that allowed 37 is not a repeatable baseline. |
| Panthers | Allowed 59, scored 37 | Raise totals sharply, both ways | Moderate on defense, near zero on offense. Most of the 37 came trailing. |
| Bills / Texans | 36-31 | Raise totals | Modest. A close high-scoring game is the most honest signal on the board. |
| Lions / Saints | 31-30 in overtime | Raise totals | Overstated. Overtime adds a full possession or more to a combined score. |
| Seahawks / Patriots | 13-10 | Lower totals | Overstated. The defending champion's opener is the least informative game of the year. |
| 49ers / Rams | 27-7 in Melbourne | Lower totals for the Rams | Near zero. The longest travel week in league history distorts everything about that result. |
| Jets / Titans, Steelers / Falcons | 33 combined each | Lower totals | Small. Two ordinary September games, correctly scored. |
The pattern is consistent. The games most likely to move a number are the ones where game state, overtime or travel did the scoring, and those are exactly the causes that do not survive into the following week. The games least likely to move a number — a 36-31 finish that stayed competitive throughout — are the ones carrying the most real information.
The Discipline That Applies Every September
The honest read on Week 1 is that the league played one historic game, five entertaining ones and ten forgettable ones, and the arithmetic mean of those sixteen outcomes happened to land on a record. Both halves of that sentence are true. Only one of them will be in the Week 2 headlines.
This is the same pattern we flagged three days into the season in the NFL Week 1 Overreaction Index, when the entire league-wide sample was two low-scoring games and the market was already leaning toward unders. The sample flipped completely within seventy-two hours. It will flip again. A week of data cannot support a directional conclusion about league scoring in either direction, and the structural items that were true before anyone played — including the kickoff and replay rewrites covered in the 2026 NFL rule changes that move live betting numbers — remain better predictors than any sixteen-game sample.
Week 2 runs Thursday through Monday. By Sunday morning the totals board will have absorbed a record that six games produced, and the ten games that finished below the week's own average will not be mentioned once. Full coverage across the board sits at football picks, the Saturday slate at college football picks, and package details at buy. More analysis is archived on the blog.
Frequently Asked Questions
How many points were scored in NFL Week 1 of the 2026 season?
791 points across 16 games, an average of 49.44 per game. That ties the 2012 opening week for the highest-scoring Week 1 of the post-merger era; both weeks produced exactly 791 points across 16 games. Three pre-merger opening weeks scored higher per game — 49.63 in 1968 and 49.50 in both 1954 and 1967 — and the all-time per-game mark belongs to 1943, when a single Week 1 game produced 52 points.
Was NFL Week 1 2026 really a high-scoring week for every team?
No. Ten of the sixteen games finished below the week's own 49.44-point average, and the median game landed at 45.0. Six games produced 409 of the 791 total points, averaging 68.2 apiece, while the other ten averaged 38.2. Four games finished at 34 combined points or fewer, including a 23-point Seahawks-Patriots opener. The record describes the week's arithmetic mean, not the experience of most of the league.
Does a record-scoring Week 1 predict a high-scoring NFL season?
There is no reliable evidence that it does, and the composition of this particular week argues against it. Roughly half the week's points came from six games, four of which were decided by nine points or more. Blowouts generate scoring through game state — a trailing team throwing on every down runs more plays, faster, and inflates both sides of the scoreboard — and game state does not carry over to the following week. The scoring that predicts future scoring comes from competitive games, of which Week 1 had relatively few.
How should the Week 1 scoring record change how I bet Week 2 totals?
Treat any upward move in a Week 2 total as something to evaluate rather than follow. The question to ask about each number is what produced the Week 1 scoring: sustained offense in a close game, or garbage-time possessions in a blowout. The first is information. The second is noise that the market is about to pay for. Where a total has moved a point or more on a blowout or an overtime finish, the value is generally on the side the crowd has left.
Why do overtime games distort combined scoring averages?
Overtime adds at least one full possession for each team, and often more, to a game that had already reached its regulation conclusion. Detroit's 31-30 overtime win over New Orleans contributed 61 points to the Week 1 total, and some portion of that scoring occurred in a period that most games never reach. When a week's average is being read as evidence about offensive quality, overtime games inflate it without telling you anything about how either offense performs in a standard sixty minutes.
What is the difference between the mean and median in NFL scoring data?
The mean is the arithmetic average of all games; the median is the middle game when every result is sorted. When the two are close, the average describes the typical game well. In NFL Week 1 of 2026 the mean was 49.44 and the median was 45.0 — a gap of more than four points, caused by a 96-point outlier in Chicago and a cluster of high-scoring blowouts pulling the mean upward. In any distribution that skewed, the median is the better description of what a typical game looked like.
Are early-season NFL overs or unders the better side after a week like this?
Neither side is a standing position, and treating one as such is how early-season totals bankrolls get drained. Week 1 of 2026 is the clearest possible demonstration: the first two games of the season produced 47 combined points and generated a wave of unders sentiment, then the Sunday slate set a scoring record seventy-two hours later. Both samples were too small to act on. The workable approach is to price each game individually, wait for the mid-week move to finish before taking a pregame position, and concentrate entries in live markets where the number recalculates against the actual score rather than against last week's story.
The Best Bet on Sports · 1.5M followers on TikTok
Sports Betting TikTok is the live betting account behind The Best Bet on Sports, covering NFL, NCAAF, NBA, NCAAB, MLB and WNBA markets in real time. The account has been limited on all six major U.S. sportsbooks — FanDuel, DraftKings, Caesars, BetMGM, Fanatics and ESPN BET — for winning on live betting, with $367,520 in verified profit since 2005. View full profile →
Past results do not guarantee future performance. Must be 21 or older to wager.
Related Articles
NFL Week 1 Overreaction Index: Ten Early-Season Traps Ranked
The NFL's First Australia Game: What a Streaming-Only Kickoff Does to Live Betting
Bears 59, Panthers 37: Chicago Beat the Game Total By Itself
A Taunting Flag Killed the Over 48.5 in Cowboys-Giants
Vikings 39, Packers 22: The Alternate Line Nobody Was Watching
Brock Bowers Is Out: What a Tight End Loss Really Moves
Get real live betting picks
From $39.95/mo · Cancel anytime · Email + Discord delivery
● Get The Picks
Choose your package
Tap any tier below to select · Subscribe in one tap
👇 Tap any package to select it
✓ You're selecting
25 Units · $99.95/month
25 unit picks per month. Sweet spot for most bettors — plenty of action without going all-in.
- ✓25 live betting selections/month
- ✓Email + Discord delivery
- ✓All sports (NFL, NCAAF, NBA, NCAAB, MLB)
- ✓Mix of 1, 2, 3, 5-unit rated plays
- ✓Cancel anytime
Secure PayPal · Cancel anytime · No hidden fees · 21+ · +$367K verified
+$367,520 verified · Limited on 6 sportsbooks · 20 years documented · See Proof
Join Our Newsletter
Get free expert sports picks and analysis delivered weekly.