NFL Home Underdogs Against the Spread: 27 Years Tested

NFL home underdogs covered 50.10 percent of the time from 1999 through 2025, going 1,198-1,193-65, which is below the 52.38 percent needed to profit at -110. Only big home dogs of 7 points or more beat that mark, at 55.27 percent, and that edge disappeared for a decade. In 2026, home underdogs are 21-37-3 against the spread through Week 10.
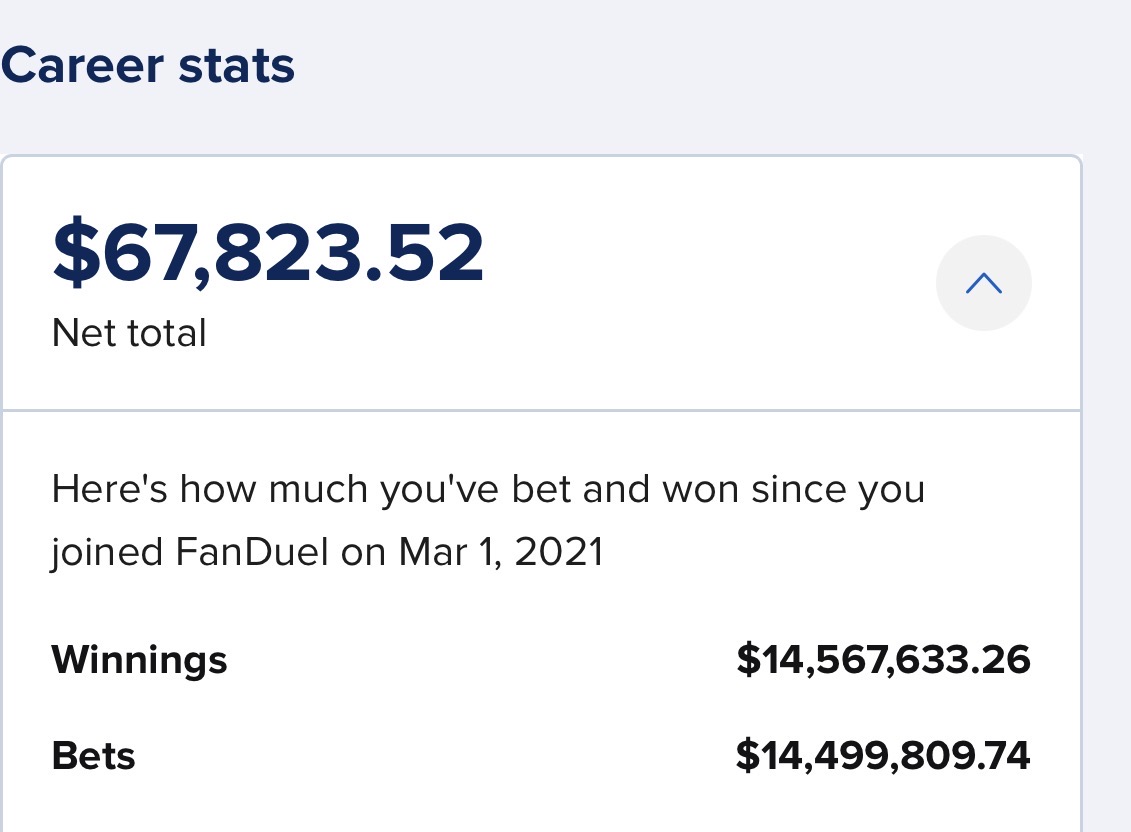
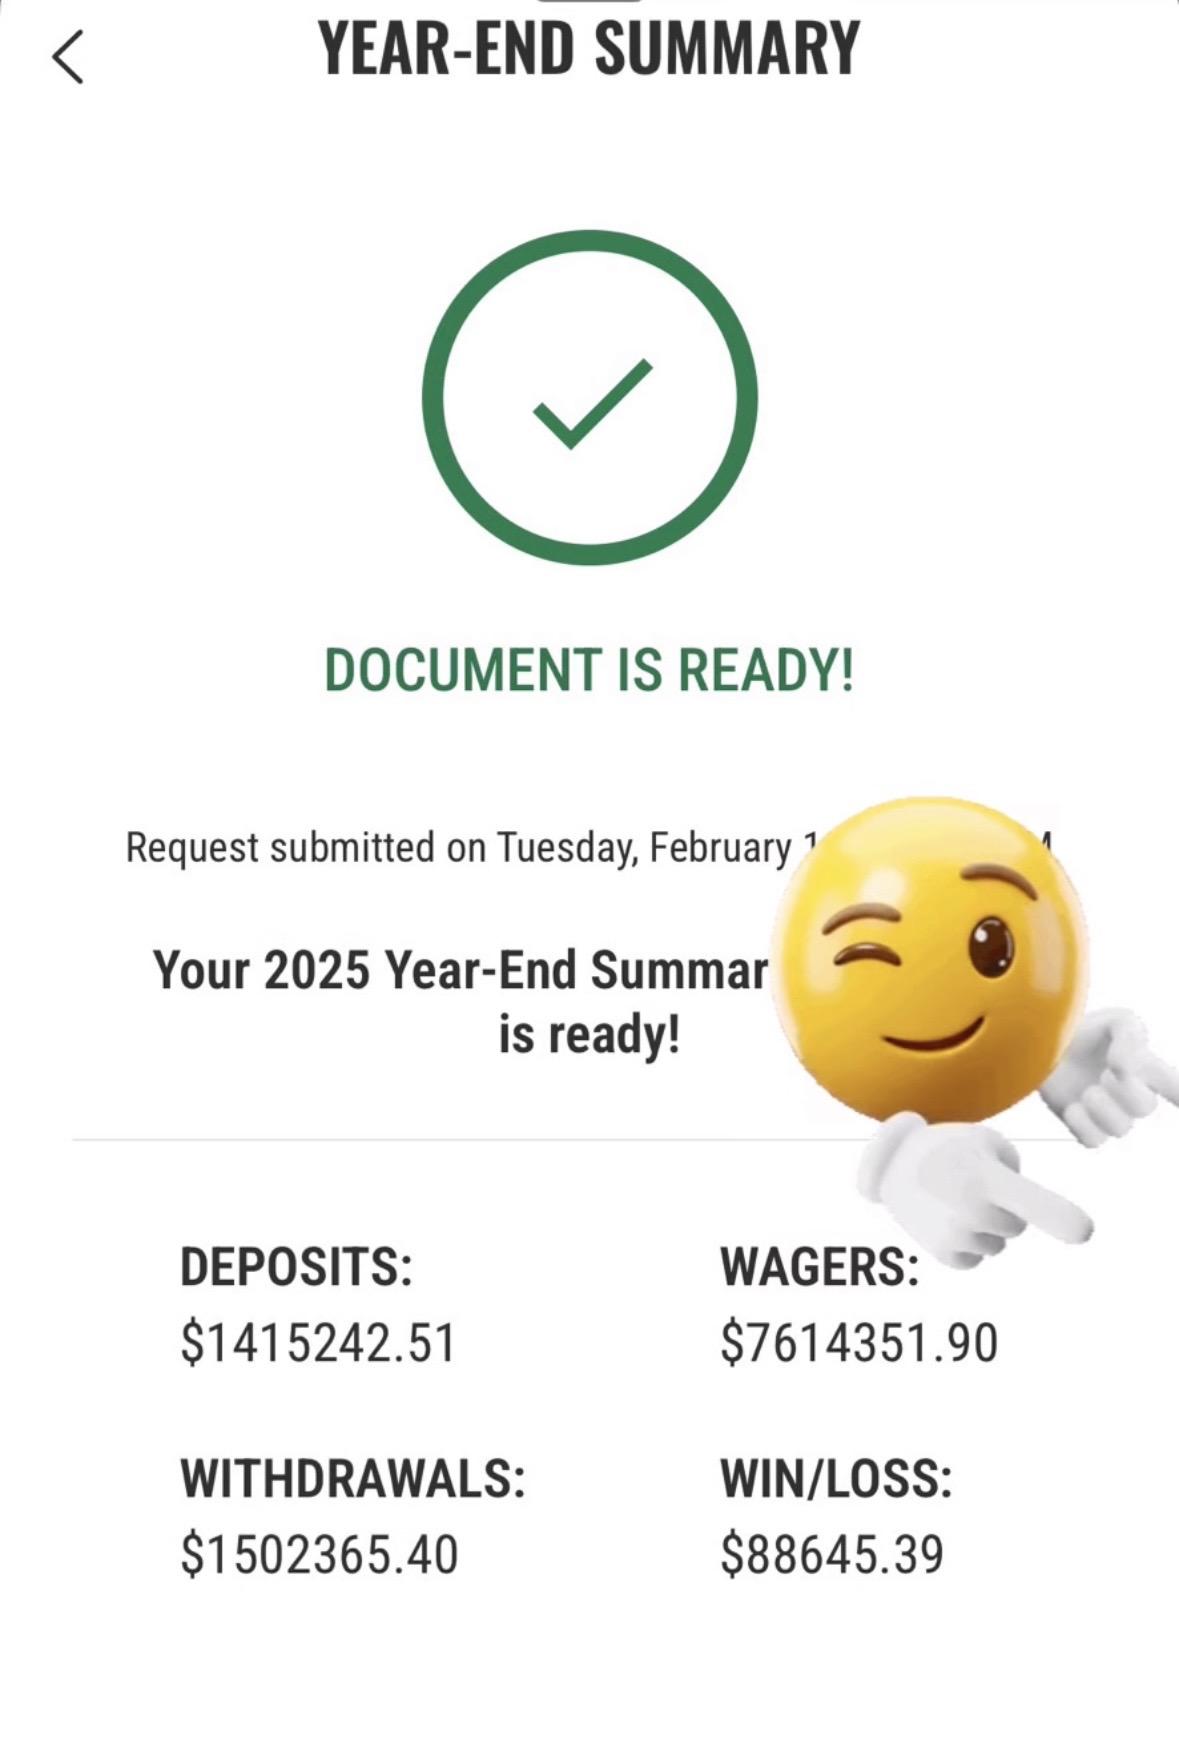
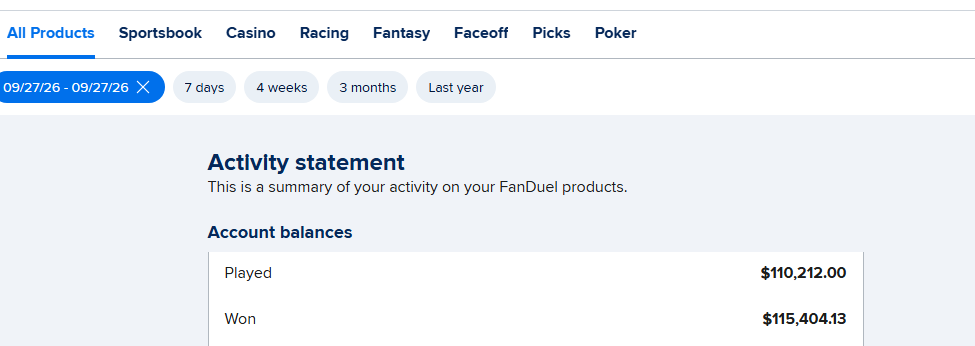
NFL home underdogs are not the automatic value bet they're often sold as. From 1999 through 2025, home underdogs went 1,198-1,193-65 against the closing spread, a 50.10 percent cover rate, which is below the 52.38 percent you need to break even at standard -110 odds. The only group that cleared that bar was big home underdogs of 7 points or more, at 278-225 (55.27 percent), and even that edge vanished from 2010 through 2019. This season the angle has been a disaster: home underdogs are 21-37-3 against the spread through Week 10 of 2026. The Best Bet on Sports has built a verified $367,520+ in profit across all sportsbooks over more than twenty years, and this is a good example of why one famous trend is not a betting system.
"Take the points at home" is one of the oldest pieces of football betting advice. The logic sounds right. The public loves favorites, home crowds help underdogs, and sportsbooks should shade the line toward the popular side.
The numbers don't back it up as a blanket rule. We graded every regular-season game since 1999 to see where the angle works, where it doesn't, and what 2026 is telling us.
How Did We Test NFL Home Underdogs?
We used the nflverse schedule file, which has the closing point spread and final score for every NFL game since 1999. We kept regular-season games from 1999 through 2025 and graded the home team against the closing number whenever it was getting points. That gave us 2,456 home underdog games. Pushes are listed but left out of the cover rate.
We added the first 10 weeks of 2026 separately, plus moneyline results from 2006 onward, the first season the file has closing moneylines.
The bar to beat is 52.38 percent. At -110, you risk $110 to win $100, so anything below 52.38 percent loses money over time.
Do Home Underdogs Cover More Often?
Barely, and not by enough to matter.
| Group, 1999-2025 | ATS record | Cover rate | Won outright |
|---|---|---|---|
| All home underdogs | 1,198-1,193-65 | 50.10% | 35.10% |
| All home favorites | 2,105-2,252-124 | 48.31% | 67.55% |
Home underdogs covered a little more often than home favorites, which fits the idea that books shade lines toward favorites. But 50.10 percent is a coin flip. If you had bet every home underdog for 27 seasons at -110, you would have lost money.
Does the Size of the Spread Matter?
Yes. This is where the story is.
| Home underdog by | ATS record | Cover rate | Won outright |
|---|---|---|---|
| 1 to 3 points | 528-549-45 | 49.03% | 43.23% |
| 3.5 to 6.5 points | 392-419-9 | 48.34% | 31.46% |
| 7 to 9.5 points | 186-157-7 | 54.23% | 25.14% |
| 10 points or more | 92-68-4 | 57.50% | 18.90% |
Short home underdogs, the ones that look most tempting because they win outright 43 percent of the time, covered 49.03 percent. The field-goal number itself was no better: home dogs of exactly 3 went 221-226-37.
Big home underdogs were different. Home teams getting 7 or more went 278-225 combined, a 55.27 percent cover rate. That clears break-even. A home team being a touchdown underdog usually means it's bad, the public knows it's bad, and the line may stretch a little too far.
Has the Big Home Underdog Edge Held Up?
Not steadily. Here it is by era.
| Era | All home dogs | Home dogs of 7+ |
|---|---|---|
| 1999-2009 | 49.94% | 55.90% (109-86) |
| 2010-2019 | 49.37% | 48.77% (79-83) |
| 2020-2025 | 51.33% | 61.64% (90-56) |
The big home underdog edge was real in the 2000s, gone for all of the 2010s, then came back hard from 2020 through 2025. A trend that disappears for 10 years and then returns is not something you can count on. The combined 278-225 record has roughly a 2 percent chance of happening by luck alone, but we tested four spread buckets, which makes one hot bucket more likely, and the decade-long dry spell is a warning.
Our study of NFL double-digit favorites found the same thing from the other side. Big favorites covered 47.81 percent, and road double-digit favorites were worse.
Why Have Home Underdogs Become More Common?
Home-field advantage has been shrinking. The average home team's margin of victory was 2.58 points from 1999 to 2009, 2.19 from 2010 to 2019, and 1.74 from 2020 to 2025. Through Week 10 of 2026, home teams are losing by an average of 0.53 points.
Sportsbooks have adjusted. From 1999 through 2016, home teams were underdogs in roughly 29 to 36 percent of games each season. Every season from 2019 through 2025 came in between 38 and 42 percent. More home underdogs means the label covers more ordinary teams and fewer special situations.
The 2020 season, played mostly without fans, was the best year for home dogs in our sample: 60-47 against the spread, 56.07 percent. Once crowds came back, results drifted back toward 50 percent.
How Are Home Underdogs Doing in 2026?
Badly. Through Week 10, home underdogs are 21-37-3 against the spread, 36.21 percent, and have won only 24.59 percent of their games outright. It isn't one bucket dragging the record down:
| 2026 home underdog by | ATS record | Cover rate |
|---|---|---|
| 1 to 3 points | 10-18-2 | 35.71% |
| 3.5 to 6.5 points | 8-14-0 | 36.36% |
| 7 points or more | 3-5-1 | 37.50% |
Home favorites aren't doing much better at 38-48-3. In games with a favorite, road teams are 85-59 against the spread this season. Home teams have won 47.33 percent of their games.
Ten weeks is a small sample, and one bad half-season doesn't prove home-field advantage has disappeared. But it should stop anyone from treating "home dog" as a reason to bet.
What Other Filters Did We Test?
We split the 27-year sample a few more ways. None produced an edge worth betting.
| Filter | ATS record | Cover rate |
|---|---|---|
| Division games | 473-484-29 | 49.43% |
| Non-division games | 725-709-36 | 50.56% |
| Primetime games | 200-215-10 | 48.19% |
| Weeks 10-13 | 271-296-20 | 47.80% |
| Weeks 14 and later | 321-300-20 | 51.69% |
| Home dog had more rest | 160-174-8 | 47.90% |
| Dome or closed roof | 308-279-10 | 52.47% |
| Outdoors | 866-891-53 | 49.29% |
Late-November games, the stretch we're in now, have been one of the worst windows for home underdogs. More rest didn't help either, which matches what we found in our bye week rest study.
Should You Bet Home Underdogs on the Moneyline?
Generally, no. From 2006 through 2025, home underdogs won 645 of 1,849 games, 34.88 percent. Betting $100 on every one at the closing moneyline returned -8.69 percent.
The short ones were the worst. Home underdogs of 1 to 3 points won 42.93 percent of the time but returned -14.23 percent, because their moneylines are short. Big home underdogs of 7 or more won only 22.28 percent, but their long prices made the return almost exactly even, +0.67 percent over 395 games.
What Are the Home Underdog Spots This Week and Next?
Week 11 has three home underdogs: the Giants (+6) against Jacksonville, the Eagles (+4.5) against Pittsburgh, and Washington (+6.5) against Cincinnati on Monday night. Week 12 adds Detroit (+2.5) against Chicago on Thanksgiving, Pittsburgh (+1.5) against Denver on Friday, plus Indianapolis (+3.5), Miami (+3) and Arizona (+6.5).
None of them are home underdogs of 7 or more, the only bucket with a long-run edge. Every one sits in the ranges that have covered under 50 percent for 27 years. If you like one of these teams, have a reason that goes beyond the home-dog label. Our Thanksgiving against-the-spread study covers the holiday games separately.
What Does This Mean When You Pay for Picks?
A lot of NFL picks get sold with a trend attached. "Home underdogs are 7-2 this year." "This team is 9-3 ATS as a home dog under this coach." Those records are real, but they come from small slices of a 50 percent pattern.
When you look at NFL expert picks or any sports handicapping service, ask three questions. How big is the sample? Has the edge held in more than one era? Is the line still where the edge was? A good handicapper can answer all three. Our NFL picks against the spread page and football handicappers guide go deeper on how to judge a record. You can also see how we track ours in the $10,000 to $100,000 challenge.
Where This Analysis Stops
We used closing spreads and moneylines from the nflverse schedule file. Opening lines can tell a different story, especially for home underdogs that get public money late. We didn't test injuries, weather, quarterback changes or line movement. The 7-point-plus bucket has only 503 graded games across 27 years, and the 2026 sample is 61 games. Past cover rates don't guarantee future ones.
Get Tonight's Live Picks
Want live in-game NFL calls sent to your phone during the game, when the live spread is weaker than the closing number?
The Best Bet on Sports is the only live betting handicapping service limited on all six major U.S. sportsbooks (FanDuel, DraftKings, Caesars, BetMGM, Fanatics, ESPN BET) for winning too much during in-game action. Verified profit: $367,520+. Live calls go out through Email and Discord during games, and every bet in the $10,000 to $100,000 challenge is posted as it happens.
→ Join The Best Bet on Sports community — newsletter, live stream and Discord → Try a free live pick first — reserve your spot for tonight's pick
Frequently Asked Questions
Do NFL home underdogs cover the spread?
About half the time. From 1999 through 2025, NFL home underdogs went 1,198-1,193-65 against the closing spread, a 50.10 percent cover rate. That's below the 52.38 percent needed to profit at standard -110 odds, so betting every home underdog would have lost money over 27 seasons. Home favorites covered 48.31 percent over the same stretch.
Are big home underdogs a good bet in the NFL?
They have been the best version of the angle. Home underdogs of 7 points or more went 278-225 against the spread from 1999 to 2025, a 55.27 percent cover rate. Underdogs of 10 or more covered 57.50 percent. But the edge disappeared from 2010 through 2019, when 7-point home dogs went 79-83, so it hasn't been reliable.
How are NFL home underdogs doing in 2026?
Poorly. Through Week 10 of the 2026 season, home underdogs are 21-37-3 against the spread, a 36.21 percent cover rate, and have won 24.59 percent of their games outright. Every spread range is below 38 percent. Home teams overall have won 47.33 percent of their games and are losing by an average of 0.53 points.
Do home underdogs of 3 points cover more often?
No. Home underdogs of exactly 3 points went 221-226-37 against the spread from 1999 through 2025, a 49.44 percent cover rate. All home underdogs of 1 to 3 points covered 49.03 percent, even though they won outright 43.23 percent of the time. The short home dog has been one of the weakest versions of the trend.
Is home-field advantage shrinking in the NFL?
Yes. The average home team's margin was 2.58 points from 1999 to 2009, 2.19 points from 2010 to 2019 and 1.74 points from 2020 to 2025. Through Week 10 of 2026, home teams are losing by 0.53 points on average. Sportsbooks have responded by making home teams underdogs in about 38 to 42 percent of games, up from about 29 to 36 percent before 2017.
Should you bet NFL home underdogs on the moneyline?
Usually not. From 2006 through 2025, home underdogs won 34.88 percent of their games, and betting every one on the closing moneyline returned -8.69 percent. Short home underdogs of 1 to 3 points returned -14.23 percent. Only home underdogs of 7 or more came close to even, at +0.67 percent over 395 games.
Which NFL home underdogs are playing in Week 11 and Week 12?
In Week 11, the Giants are 6-point home underdogs to Jacksonville, the Eagles are 4.5-point home underdogs to Pittsburgh, and Washington is a 6.5-point home underdog to Cincinnati on Monday night. Week 12 home underdogs include Detroit against Chicago on Thanksgiving, Pittsburgh against Denver, Indianapolis, Miami and Arizona. None are 7-point home dogs.
The Best Bet on Sports · 1.5M followers on TikTok
Sports Betting TikTok is the live betting account behind The Best Bet on Sports, covering NFL, NCAAF, NBA, NCAAB, MLB and WNBA markets in real time. The account has been limited on all six major U.S. sportsbooks — FanDuel, DraftKings, Caesars, BetMGM, Fanatics and ESPN BET — for winning on live betting, with $367,520 in verified profit since 2005. View full profile →
Past results do not guarantee future performance. Must be 21 or older to wager.
Related Articles
NFL Double-Digit Favorites Against the Spread: 27 Years Tested
NFL Christmas Day Against the Spread: Favorites Are 9-19-1
Do NFL Coaches Keep Covering? ATS Records Tested
NFL Over/Under After a Shootout: 27 Years Tested
Top NFL Handicappers Review and Rating: What Separates the Best from the Rest
NFL Look-Ahead Spots, Tested
Get real live betting picks
From $39.95/mo · Cancel anytime · Email + Discord delivery
● Get The Picks
Choose your package
Tap any tier below to select · Subscribe in one tap
👇 Tap any package to select it
✓ You're selecting
25 Units · $99.95/month
25 unit picks per month. Sweet spot for most bettors — plenty of action without going all-in.
- ✓25 live betting selections/month
- ✓Email + Discord delivery
- ✓All sports (NFL, NCAAF, NBA, NCAAB, MLB)
- ✓Mix of 1, 2, 3, 5-unit rated plays
- ✓Cancel anytime
Secure PayPal · Cancel anytime · No hidden fees · 21+ · +$367K verified
+$367,520 verified · Limited on 6 sportsbooks · 20 years documented · See Proof
Join Our Newsletter
Get free expert sports picks and analysis delivered weekly.