The Bye-Week Edge, Tested on 11 NFL Seasons

NFL teams coming off a bye week did not cover the spread more often than anyone else from 2015 through 2025. Against the closing line they went 170-171-11, a 49.85 percent cover rate, well short of the 52.38 percent needed to profit at standard pricing. The trend looked strong in 2015 and 2016 and has run at 47.21 percent since. Here is what that says about buying NFL expert picks built on situational trends.
The bye-week edge is one of the most repeated claims in NFL betting, and over the last eleven seasons it has not existed. From 2015 through 2025, teams coming off a bye went 170-171-11 against the closing spread, a 49.85 percent cover rate, short of the 52.38 percent you need to profit at -110. The trend was real-looking in 2015 and 2016, at 61.11 percent, and has run at 47.21 percent in the nine seasons since. The Best Bet on Sports has built a verified $367,520+ in profit across all sportsbooks over more than twenty years, and none of it came from a scheduling trend. This is what we found when we tested the most popular ones.
Bye weeks begin to matter right about now, and the pitch you are about to hear everywhere goes like this: a team with two weeks to prepare, heal and game-plan is going to be sharper than a team that played six days ago, so back the rested team. It sounds like common sense, and it is the kind of claim that gets sold as an edge in nfl expert picks every October.
It also appears all over betting media, and earlier posts on this site repeated versions of it. The data below is the reason we no longer do.
How Did We Test the Bye-Week Edge?
We used every NFL regular-season game from 2015 through 2025 in the nflverse game file, 2,895 games with a closing spread and a final score. The file records how many days of rest each team had before each game, which lets you identify rest situations precisely rather than by memory.
A team was counted as coming off a bye when it had 13 or more days of rest, excluding Week 1. Every game was graded from the rested team's side against the closing spread, so a cover means the team beat the number the market settled on, not just that it won.
The closing number matters. Any trend can look good against a stale opening line or against the straight-up result. The question a bettor actually faces is whether the trend beats the price available to bet.
Do NFL Teams Cover More Often After a Bye?
No.
| Situation | Record against the spread | Cover rate | 95% range |
|---|---|---|---|
| All post-bye teams | 170-171-11 | 49.85% | 44.5% to 55.2% |
| Post-bye vs a team not coming off a bye | 143-144-7 | 49.83% | 44.0% to 55.6% |
| Post-bye at home | 65-74-6 | 46.76% | 38.5% to 55.1% |
| Post-bye on the road | 78-70-1 | 52.70% | 44.7% to 60.7% |
| Post-bye as the favorite | 76-81-6 | 48.41% | 40.6% to 56.2% |
| Post-bye as the underdog | 67-63-1 | 51.54% | 42.9% to 60.1% |
Every row includes 50 percent in its plausible range, and only one clears 52.38 percent, the break-even rate at standard -110 pricing: road teams, by a third of a point, on 149 games. The headline split, rested teams against teams that played the previous week, is 143 covers and 144 non-covers. It is hard to construct a cleaner coin flip from real data.
The two splits that look interesting, road teams and underdogs, are each based on fewer than 150 games, and their ranges run from the mid-40s to around 60 percent. That is what noise looks like when it is sliced finely enough to find a pattern.
Why Doesn't Extra Rest Show Up Against the Spread?
Because the market already prices it.
The rest advantage is not hidden information. Every sportsbook, every bettor and every model knows which teams are coming off a bye, and the closing number is the point at which all of that knowledge has been weighed. Post-bye teams in this sample closed as favorites by an average of 0.96 points against opponents who had played the week before. Their actual average margin was +0.77 points. The market's estimate of the bye advantage and the real one were almost the same number.
That is the general lesson in one measurement. A situational factor that everyone knows about stops being an edge the moment it is priced, and in a market as liquid as the NFL, that happens long before kickoff. We showed how large the closing spread's ordinary error is in the closing spread misses by ten points. A one-point rest effect inside a ten-point cloud is not something you can bet profitably once the price has moved to absorb it.
How Does a Trend Like This Get Sold?
By showing you the right two years.
| Season | Post-bye teams against the spread | Cover rate |
|---|---|---|
| 2015 | 15-11-0 | 57.69% |
| 2016 | 18-10-2 | 64.29% |
| 2017 | 13-13-2 | 50.00% |
| 2018 | 14-12-0 | 53.85% |
| 2019 | 11-17-0 | 39.29% |
| 2020 | 13-15-0 | 46.43% |
| 2021 | 11-13-2 | 45.83% |
| 2022 | 13-13-0 | 50.00% |
| 2023 | 11-10-1 | 52.38% |
| 2024 | 10-18-0 | 35.71% |
| 2025 | 14-12-0 | 53.85% |
Imagine evaluating this trend in the summer of 2017. Over the previous two seasons, post-bye teams had gone 33-21-2 against the spread, a 61.11 percent cover rate. That is an attractive number, and it was a real record of real games. A service selling it would not have been lying about the history.
Over the next nine seasons, the same trend went 110-123-5, a 47.21 percent cover rate, and lost money at standard pricing.
That is how almost every situational betting trend works. A small sample produces an eye-catching record, the record is marketed, and the regression that follows is quietly attributed to bad luck. Our post on NFL handicapping myths makes the general case. This table is the specific case.
What About Thursday Night and Other Rest Gaps?
They tested the same way.
| Situation | Record against the spread | Cover rate |
|---|---|---|
| Thursday road team (Week 2 on) | 86-92-8 | 48.31% |
| Thursday road underdog | 53-59-4 | 47.32% |
| Thursday home team | 92-86-8 | 51.69% |
| Rest advantage of 3+ days, byes excluded | 177-159-6 | 52.68% |
| Every home team, neutral sites excluded | 1,351-1,422-73 | 48.72% |
The best-looking line here, teams with a rest advantage of three or more days outside of byes, is 52.68 percent across 342 games, with a plausible range from 47.3 to 58.0 percent. That is not distinguishable from break-even, let alone from a coin flip.
One finding surprised us. A frequently cited Thursday scenario, a team coming off its bye to face an opponent on short rest, did not occur once in the 2015 through 2025 regular seasons in this dataset. No team playing on a Thursday after Week 1 had more than seven days of rest. The schedule simply does not produce that matchup, which means any edge described for it is an edge on a game that is not on the board. Our own older Thursday night football picks guide describes that matchup, and this data is the correction.
To be clear about that callout: this study uses closing spreads and final scores only. It contains no in-game prices, so it cannot measure whether rest effects are easier to exploit live. The argument for working inside the game is structural reasoning, not a finding from these 2,895 games.
What Should You Expect From NFL Expert Picks?
Not a trend.
If a service's main selling point is a situational angle, such as rest, travel, divisional revenge, Thursday games or the week after a blowout, it is selling you information the closing line already contains. The record attached to it may be completely real and still tell you nothing, as the 2015-2016 bye-week numbers show.
What a real sports handicapping service owes you is a method that can be checked and a record graded against the prices you could actually bet. Ask where the edge comes from in terms that would still hold up if every sportsbook knew about it. If the answer is a fact anyone can look up, like a team's rest days, the market has looked it up too.
Our position on that is on the expert sports picks page, the practical comparison of what you get for the money is on pay for sports picks, and the weekly against-the-spread board is on NFL spread picks. If you want to see how we read a season of football, our football handicappers page sets it out, and every graded result is on the results page.
For how to tell real records from lucky ones, start with how to read a sports betting track record.
Where This Analysis Stops
Four limits.
This is the NFL regular season only, 2015 through 2025, against closing spreads. It says nothing about opening lines, which are less efficient and could carry rest information the market has not yet absorbed. Nor does it cover college football, where bye-week scheduling and talent gaps are very different.
Bye weeks were identified from rest days rather than from a schedule flag, so a handful of unusual scheduling gaps may be counted as byes. The effect on the totals is small, and it would not create an edge where there is none.
Small effects can hide inside large ranges. A true bye edge of one or two percentage points cannot be ruled out by 352 games. But an edge that small would not survive -110 pricing, which is the only test a bettor cares about.
And this is not an argument that rest does not matter physically. It almost certainly does. It is an argument that the market knows that too, and prices it before you get the chance to bet it.
Get Tonight's Live Picks
Want tonight's live in-game picks delivered during the game, after the rest advantage has either shown up on the field or failed to?
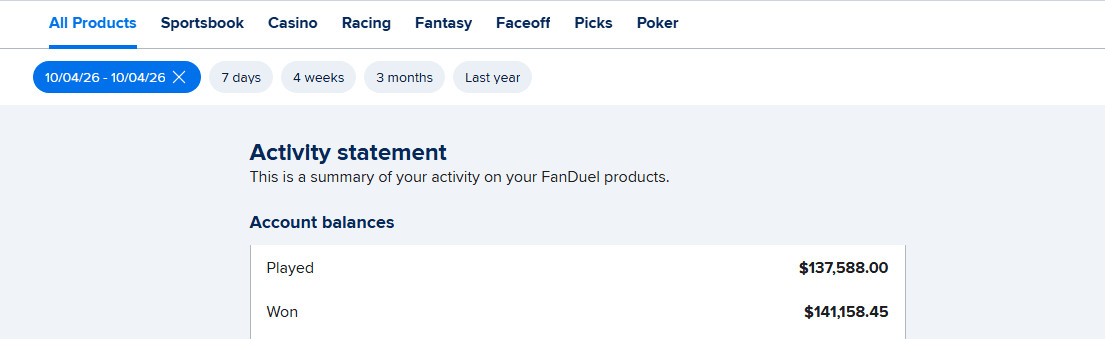
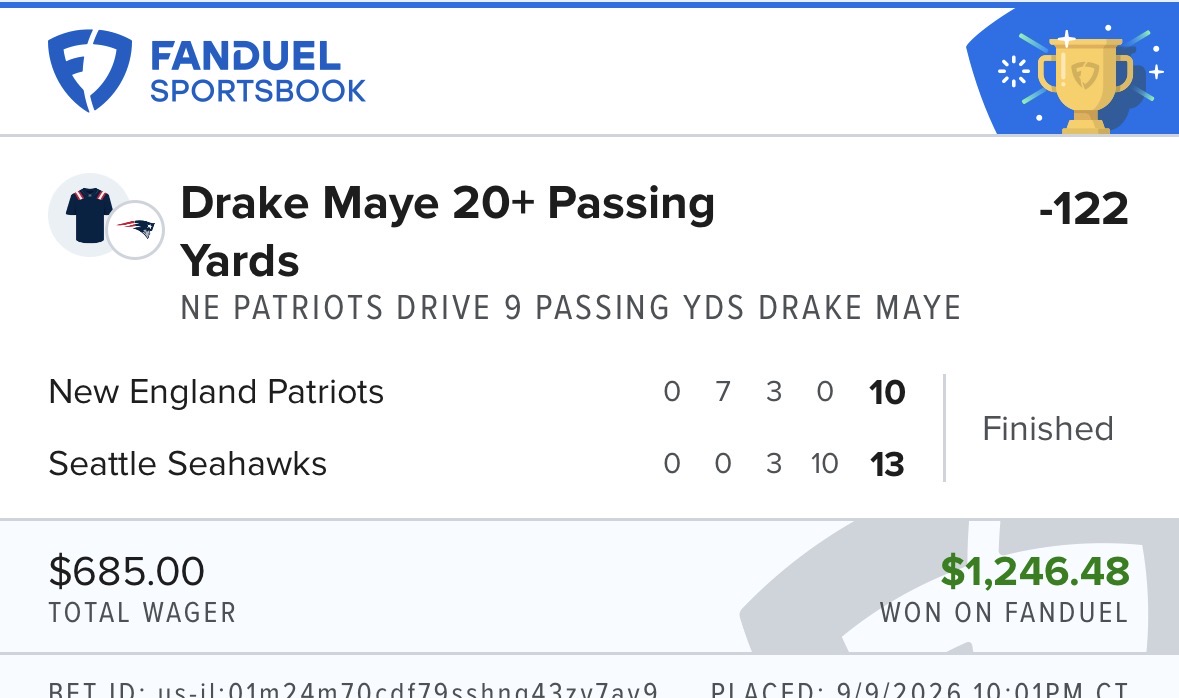
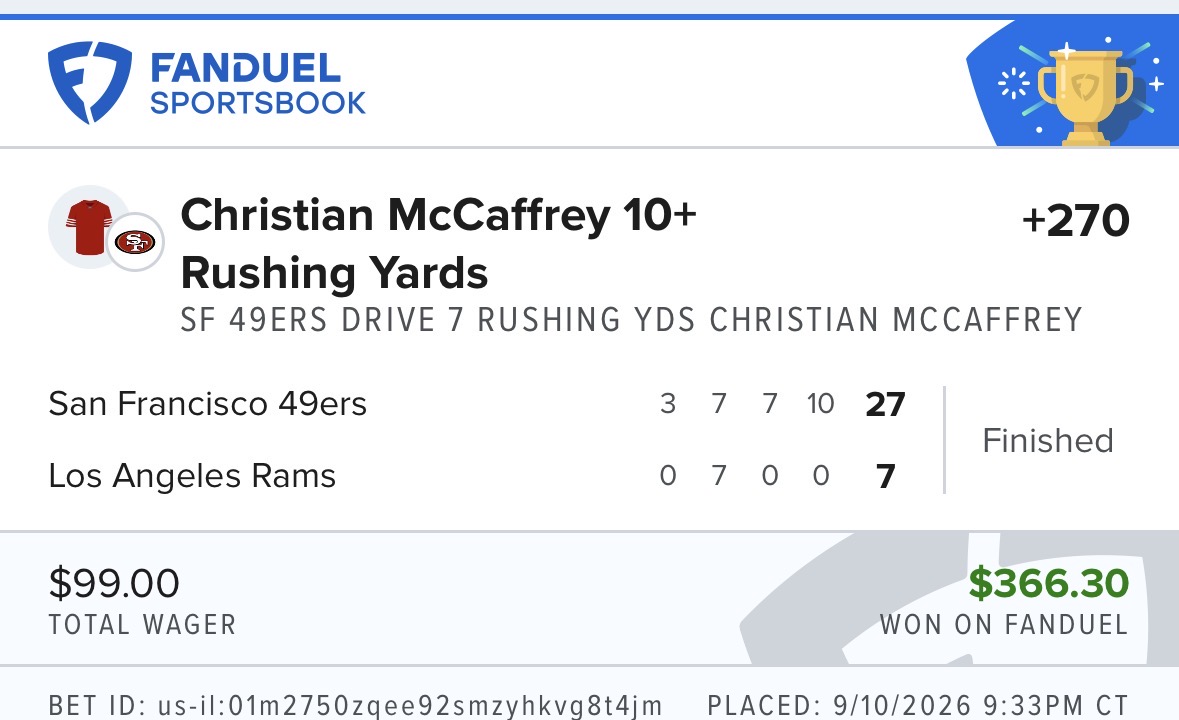
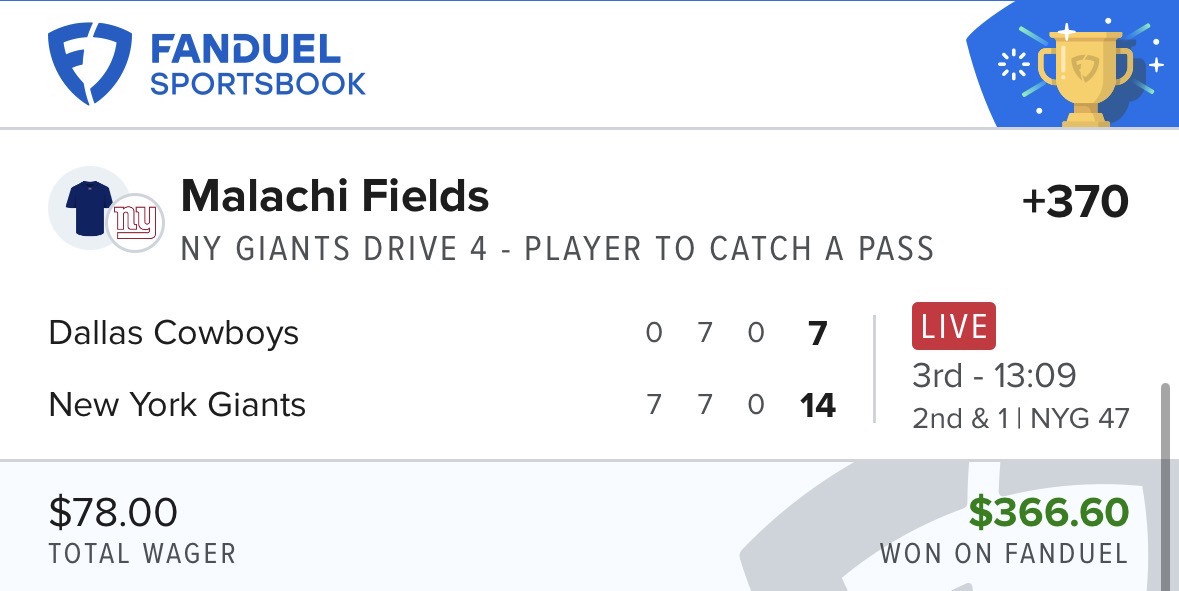
The Best Bet on Sports is the only live betting handicapping service limited on all six major U.S. sportsbooks (FanDuel, DraftKings, Caesars, BetMGM, Fanatics, ESPN BET) for winning too much during in-game action. Verified profit: $367,520+. Picks delivered via Email and Discord during games.
→ Get tonight's live picks: $199 first month — 1-Unit package, full live betting access → Try a live pick first — reserve your spot for tonight's pick
Compare every package on buy sports picks or read what arrives each day from daily sports betting picks.
Frequently Asked Questions
Do NFL teams cover the spread more often after a bye week?
No. From 2015 through 2025, NFL teams coming off a bye went 170-171-11 against the closing spread, a 49.85 percent cover rate. Against opponents who had played the previous week they went 143-144-7. Neither figure approaches the 52.38 percent needed to profit at standard -110 pricing.
Why do people believe in the bye-week edge?
Because the logic is sound and short samples support it. In 2015 and 2016, post-bye teams covered 61.11 percent of the time. Anyone evaluating the trend in 2017 saw a real, attractive record. Over the next nine seasons the same trend covered 47.21 percent.
Does the betting market account for rest days?
Yes. Post-bye teams in this sample closed as favorites by an average of 0.96 points against opponents who had played the week before, and their actual average margin was 0.77 points. The closing spread's estimate of the rest advantage was almost exactly the real one, which leaves nothing to bet.
Are road teams on Thursday night a good bet against the spread?
Not on this evidence. From Week 2 on, road teams in Thursday games went 86-92-8 against the closing spread from 2015 through 2025, a 48.31 percent cover rate, and road underdogs on Thursdays covered 47.32 percent. Home teams went 92-86-8. None of those is distinguishable from a coin flip.
Do teams play on Thursday right after a bye week?
Not in the 2015 through 2025 regular seasons in this dataset. No team playing on a Thursday after Week 1 had more than seven days of rest, so the often-described matchup of a post-bye team against a short-rest opponent on Thursday did not occur once.
Should I pay for NFL expert picks based on situational trends?
We would not. A trend based on public information such as rest, travel or scheduling is already reflected in the closing spread, and its historical record can be real and still meaningless, as the bye-week trend shows. A service worth paying for explains an edge the market does not already price and grades its record against bettable prices.
What cover rate do you need to profit against the spread?
About 52.38 percent at standard -110 pricing, because you risk $110 to win $100. Only two rest-based situations tested here cleared it, both barely: post-bye road teams at 52.70 percent across 149 games, and teams with a rest advantage of three or more days outside of byes at 52.68 percent across 342 games. Both have plausible ranges that reach well below 50 percent.
The Best Bet on Sports · 1.5M followers on TikTok
Sports Betting TikTok is the live betting account behind The Best Bet on Sports, covering NFL, NCAAF, NBA, NCAAB, MLB and WNBA markets in real time. The account has been limited on all six major U.S. sportsbooks — FanDuel, DraftKings, Caesars, BetMGM, Fanatics and ESPN BET — for winning on live betting, with $367,520 in verified profit since 2005. View full profile →
Past results do not guarantee future performance. Must be 21 or older to wager.
Related Articles
The Closing Spread Misses by Ten Points
The 1 PM Problem: When Sunday Parlays Actually Die
Key Numbers and Parlays: The Three-Point Problem
Should Pick Service Bets Have Their Own Bankroll?
Best NFL Picks Service 2026 - What to Look for in a Sports Handicapper
How NFL Betting Units Work - A Complete Guide for Sports Bettors
Get real live betting picks
From $39.95/mo · Cancel anytime · Email + Discord delivery
● Get The Picks
Choose your package
Tap any tier below to select · Subscribe in one tap
👇 Tap any package to select it
✓ You're selecting
25 Units · $99.95/month
25 unit picks per month. Sweet spot for most bettors — plenty of action without going all-in.
- ✓25 live betting selections/month
- ✓Email + Discord delivery
- ✓All sports (NFL, NCAAF, NBA, NCAAB, MLB)
- ✓Mix of 1, 2, 3, 5-unit rated plays
- ✓Cancel anytime
Secure PayPal · Cancel anytime · No hidden fees · 21+ · +$367K verified
+$367,520 verified · Limited on 6 sportsbooks · 20 years documented · See Proof
Join Our Newsletter
Get free expert sports picks and analysis delivered weekly.