NFL Cross-Country Trips, Tested

Long NFL road trips have not hurt teams against the spread. From 2000 through 2025, road teams traveling 2,000 miles or more covered 51.00 percent of 664 regular-season games, almost identical to the 51.12 percent for all road teams. The market adds only about 0.4 points of home edge for distance, and the one weak band, 1,200 to 1,800 miles, looks like noise.
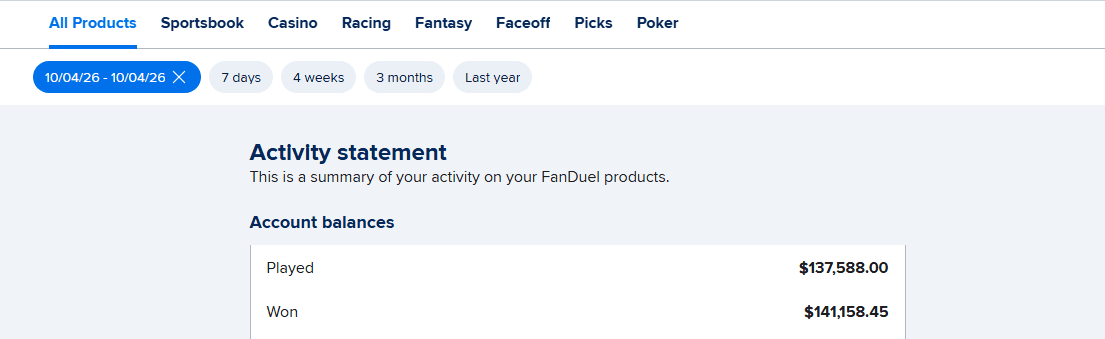
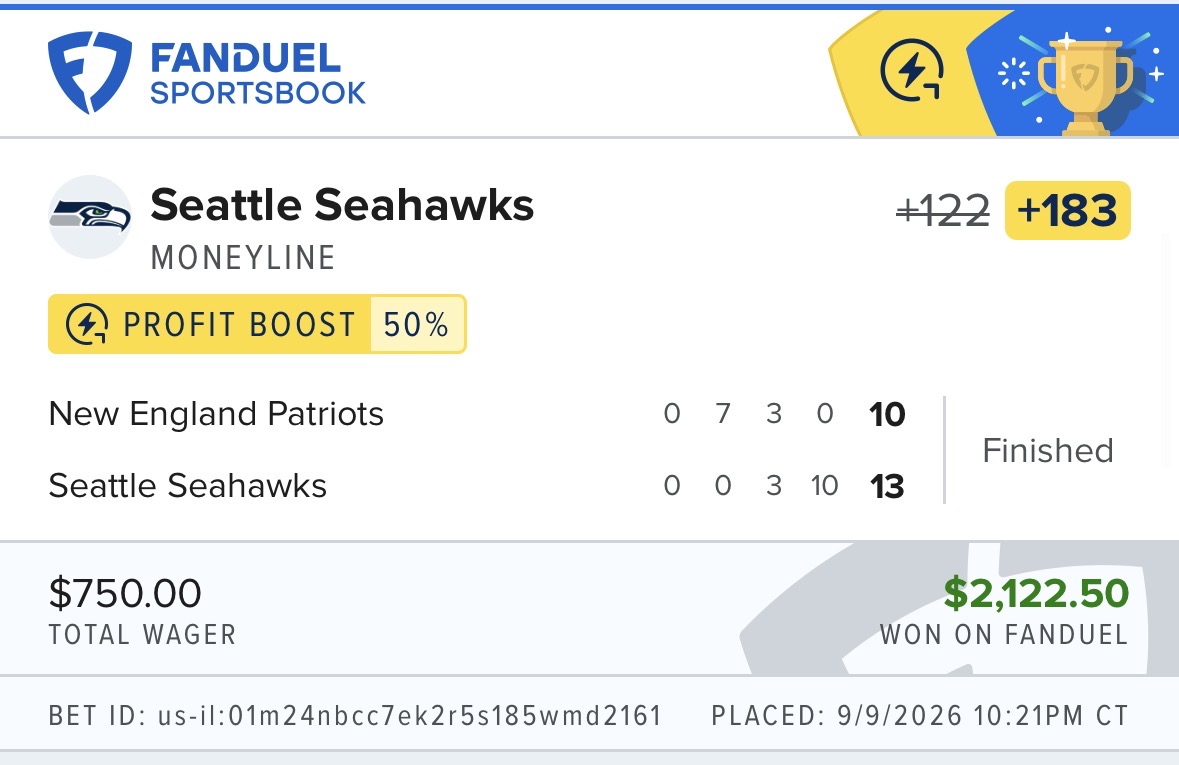
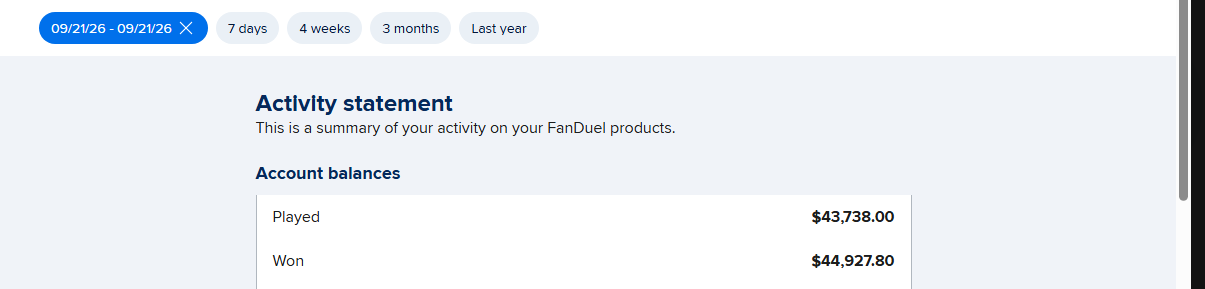
Long road trips have not made NFL teams worse bets against the spread. Across 6,653 regular-season games from 2000 through 2025, road teams that traveled 2,000 miles or more covered 51.00 percent of the time (330-317-17), essentially the same as the 51.12 percent rate for every road team. The closing spread gave home teams only about 0.4 more points for the longest trips than for the shortest, and the market was right not to charge more. The Best Bet on Sports has built a verified $367,520+ in profit across all sportsbooks over more than twenty years by checking handicapping rules like this one before using them.
"Fade the team flying cross-country" is one of the oldest lines in football handicapping. It sounds like common sense. Players are on a plane for five or six hours, sleep in a hotel, and play in a building full of people who want them to lose. If a pick service tells you a team is "on a brutal road trip," it is offering travel as a reason.
We already tested one piece of this, the West Coast team playing a 1 p.m. Eastern kickoff, which is about the body clock. This study is about distance itself: does a long flight cost a team points that the betting market forgets to charge?
How Did We Measure NFL Travel Distance?
We used the nflverse game dataset, which has closing spreads and final scores for every NFL game. We kept regular-season games from 2000 through 2025 played at one team's home stadium, which removes London, Germany, Mexico City and other neutral-site games where travel affects both teams. That left 6,653 games.
For each game, we measured the straight-line distance between the road team's home stadium and the home team's stadium, using each franchise's stadium for that season. Relocations count. The Raiders' trips change when they moved from Oakland to Las Vegas, and the Rams and Chargers change when they moved to Los Angeles. Straight-line distance is not flight distance, but it ranks trips in the same order.
Each road team was graded against the closing spread. Pushes are removed from cover rates. The break-even rate at standard -110 pricing is 52.38 percent.
Do Long Trips Hurt NFL Road Teams Against the Spread?
Here is every road team, grouped by how far it traveled.
| Trip distance, 2000-2025 | Games | Road ATS | Road cover rate | Home won outright | Road margin, actual | Road margin, expected |
|---|---|---|---|---|---|---|
| Under 300 miles | 1,066 | 531-507-28 | 51.16% | 54.69% | -2.03 | -2.06 |
| 300 to 700 miles | 1,876 | 933-892-51 | 51.12% | 55.97% | -2.40 | -2.14 |
| 700 to 1,200 miles | 1,755 | 908-797-50 | 53.26% | 55.38% | -1.67 | -2.27 |
| 1,200 to 1,800 miles | 1,042 | 474-540-28 | 46.75% | 59.69% | -3.50 | -2.33 |
| 1,800 to 2,400 miles | 719 | 367-335-17 | 52.28% | 54.80% | -1.88 | -2.14 |
| Over 2,400 miles | 188 | 94-89-5 | 51.37% | 54.79% | -1.76 | -2.47 |
The expected margin column is the closing spread. It shows how much the market charged for distance: road teams on trips under 300 miles were expected to lose by 2.06 points, and road teams on trips over 2,400 miles by 2.47. That is about 0.4 points for crossing the country.
The actual results say even that was enough. Teams on the longest trips lost by less than the spread expected, and they covered more than 51 percent of the time. Nothing in the 1,800-plus mile rows looks like a team worn down by travel.
What About the Weak 1,200 to 1,800 Mile Band?
It is the one row that looks like an angle, and it probably is not. Road teams in that band covered 46.75 percent of the time across 1,042 games and lost by 1.2 points more than expected. Fading them would have covered 53.25 percent, just above break-even.
Three things argue against betting it. First, it was one of six bands we tested, and with six bands one is likely to look unusual by chance. Second, the effect is not about distance, because the bands on both sides of it, shorter and longer, covered more than 51 percent. A real travel penalty would grow with the miles, not appear in the middle and vanish. Third, it held in both halves of the data, 48.73 percent from 2000 to 2012 and 44.71 percent from 2013 to 2025, but the plausible range on a sample this size still runs from roughly 43.7 to 49.8 percent, close enough to 50 that a few seasons of normal results could erase it.
If someone sells you a "1,500-mile rule," ask why 2,000 miles does not work.
Has the Long-Trip Result Changed Over Time?
Yes, and the change runs the opposite way from the folklore.
| Trip distance | 2000-2012 road cover | 2013-2025 road cover |
|---|---|---|
| Under 300 miles | 54.99% (528) | 47.44% (538) |
| 300 to 700 miles | 50.38% (941) | 51.86% (935) |
| 700 to 1,200 miles | 53.86% (877) | 52.64% (878) |
| 1,200 to 1,800 miles | 48.73% (528) | 44.71% (514) |
| 1,800 to 2,400 miles | 47.30% (324) | 56.33% (395) |
| Over 2,400 miles | 45.92% (101) | 57.65% (87) |
From 2000 through 2012, the longest trips did look like a fade. Teams flying 1,800 miles or more covered about 47 percent. From 2013 through 2025, they covered about 56.5 percent, and the market's expected road margin for the 1,800 to 2,400 band dropped to -1.60 points while those teams actually lost by only 0.18 points on average.
The likely story is that teams adapted. Charter flights, sleep scheduling, leaving a day early and better recovery work have all become standard. A bettor still fading cross-country trips in 2026 is using a rule from a different league.
Season to season, the results are wild. Road teams on 2,000-mile trips covered 72.4 percent of the time in 2019 and 38.9 percent in 2022. Any single season is a coin-flip story.
Do Rest, Direction or Kickoff Time Change the Answer?
Not in a way you can bet. We split the 664 trips of 2,000 miles or more three ways.
| Split, trips of 2,000+ miles | Games | Road cover rate |
|---|---|---|
| Road team had less rest than home team | 98 | 46.74% |
| Same rest | 434 | 52.12% |
| Road team had more rest | 132 | 50.38% |
| Traveling west | 333 | 50.00% |
| Traveling east | 331 | 52.01% |
| Kickoff at 4 p.m. Eastern or later | 398 | 50.77% |
| Earlier kickoff | 266 | 51.35% |
| Road underdogs | 428 | 49.88% |
| Road favorites | 236 | 53.04% |
The short-rest row is the only one that leans, and 98 games is far too few to separate from luck. Direction barely matters. Kickoff time barely matters once distance is the question, which fits what our West Coast early-kickoff study found about how much the body-clock edge has faded. Rest itself is covered in our bye-week rest test.
How Have Long Trips Gone in 2026?
Through Week 7, road teams on trips of 2,000 miles or more are 3-8-1 against the spread in 12 games, including the Giants' 22-point loss with the Rams favored by 6.5 in Week 2 and the Raiders' 28-point loss as a 3.5-point underdog in New England in Week 5. Twelve games is a sample that would look like a trend on television and means nothing here. The 26-season rate is 51.00 percent.
Which Week 8 Games Involve Long Trips?
Two. Las Vegas travels about 2,230 miles to face the Jets, with New York favored by 1.5 in the dataset's line as of Oct. 30. Chicago travels about 1,730 miles to Seattle for Monday night, with the Seahawks favored by 3. The Bears' trip falls in the 1,200 to 1,800 mile band, the weak row in the table above, which is exactly the kind of coincidence that sells a bad rule. We are not taking a side in either game. Quarterback play, injuries and matchups will matter far more than the flight.
Why Does This Matter When You Pay for Picks?
Because travel is one of the most common reasons a pick service gives for a play, and it is one of the easiest to test. A good handicapper should be able to show you that a reason has worked recently, not just that it sounds right. If the explanation for a pick is "brutal cross-country trip," that is a sign the service is repeating folklore.
Our NFL picks against the spread and NFL expert picks are built on what teams are doing on the field, and we report every result on our results page. If you are comparing a sports handicapping service, ask each one which of its rules it has tested against the closing line. Our football handicappers page explains how we approach the weekly card, and with the NBA season under way, our basketball handicappers page shows how the same testing applies to basketball, where travel and back-to-backs come up every night.
Get Tonight's Live Picks
Want tonight's live in-game picks, built on what each team is showing in the first quarter rather than on how far it flew, delivered to your phone during the game?
The Best Bet on Sports is the only live betting handicapping service limited on all six major U.S. sportsbooks (FanDuel, DraftKings, Caesars, BetMGM, Fanatics, ESPN BET) for winning too much during in-game action. Verified profit: $367,520+. Picks delivered via Email and Discord during games.
→ Get tonight's live picks: $199 first month — 1-Unit package, full live betting access → Try a live pick first — reserve your spot for tonight's pick
You can also browse our NFL picks or our football betting picks.

Frequently Asked Questions
Do NFL teams cover less after long road trips?
No. From 2000 through 2025, road teams that traveled 2,000 miles or more covered 51.00 percent of 664 regular-season games, nearly identical to the 51.12 percent rate for all road teams. They lost by slightly less than the closing spread expected.
How much does the betting market charge for NFL travel?
Very little. Road teams on trips under 300 miles were expected to lose by 2.06 points at the closing spread, and road teams on trips over 2,400 miles by 2.47 points. That roughly 0.4-point difference was enough, because the longest trips did not produce worse results.
Is there any NFL travel distance that is worth fading?
Road teams traveling 1,200 to 1,800 miles covered only 46.75 percent of 1,042 games, but it was one of six bands tested and the bands on both sides covered more than 51 percent. A real travel penalty would grow with distance, so this looks like chance rather than an angle.
Did cross-country travel used to matter in the NFL?
It appears to have. From 2000 through 2012, road teams traveling 1,800 miles or more covered about 47 percent of the time. From 2013 through 2025 they covered about 56.5 percent. Modern travel and recovery routines are the likely reason the old fade stopped working.
Does travel direction matter for NFL road teams?
Not much. On trips of 2,000 miles or more, teams traveling west covered 50.00 percent of the time and teams traveling east covered 52.01 percent from 2000 through 2025. Neither is far enough from 50 percent to bet on.
Which Week 8 NFL games in 2026 involve long road trips?
Las Vegas travels about 2,230 miles to play the Jets, and Chicago travels about 1,730 miles to Seattle for Monday night. In the dataset's lines on Oct. 30, the Jets were favored by 1.5 and the Seahawks by 3. Lines can move before kickoff.
What should I ask a pick service that cites travel as a reason?
Ask whether the rule has been tested against the closing spread in recent seasons. Long trips covered 51.00 percent over 26 seasons, so a service relying on travel alone is using a reason the market already prices correctly.
The Best Bet on Sports · 1.5M followers on TikTok
Sports Betting TikTok is the live betting account behind The Best Bet on Sports, covering NFL, NCAAF, NBA, NCAAB, MLB and WNBA markets in real time. The account has been limited on all six major U.S. sportsbooks — FanDuel, DraftKings, Caesars, BetMGM, Fanatics and ESPN BET — for winning on live betting, with $367,520 in verified profit since 2005. View full profile →
Past results do not guarantee future performance. Must be 21 or older to wager.
Related Articles
NFL Letdown Spots, Tested
NFL Division Revenge Games, Tested
First-Year NFL Coaches ATS, Tested
West Coast Teams at 1 PM ET: ATS Tested
4-0 Against the Spread: What a Hot Start Predicts
The Bye-Week Edge, Tested on 11 NFL Seasons
Get real live betting picks
From $39.95/mo · Cancel anytime · Email + Discord delivery
● Get The Picks
Choose your package
Tap any tier below to select · Subscribe in one tap
👇 Tap any package to select it
✓ You're selecting
25 Units · $99.95/month
25 unit picks per month. Sweet spot for most bettors — plenty of action without going all-in.
- ✓25 live betting selections/month
- ✓Email + Discord delivery
- ✓All sports (NFL, NCAAF, NBA, NCAAB, MLB)
- ✓Mix of 1, 2, 3, 5-unit rated plays
- ✓Cancel anytime
Secure PayPal · Cancel anytime · No hidden fees · 21+ · +$367K verified
+$367,520 verified · Limited on 6 sportsbooks · 20 years documented · See Proof
Join Our Newsletter
Get free expert sports picks and analysis delivered weekly.