Bad NFL Teams Against the Spread

Bad NFL teams have not been bad bets against the spread. From 2002 through 2025, teams that had won 20 percent or fewer of their games after at least five weeks covered 50.68 percent of 894 games, and the market's spread matched their actual average margin within 0.6 points. Teams with one win or fewer after six games covered 53.08 percent, while elite teams covered only 48.11 percent.
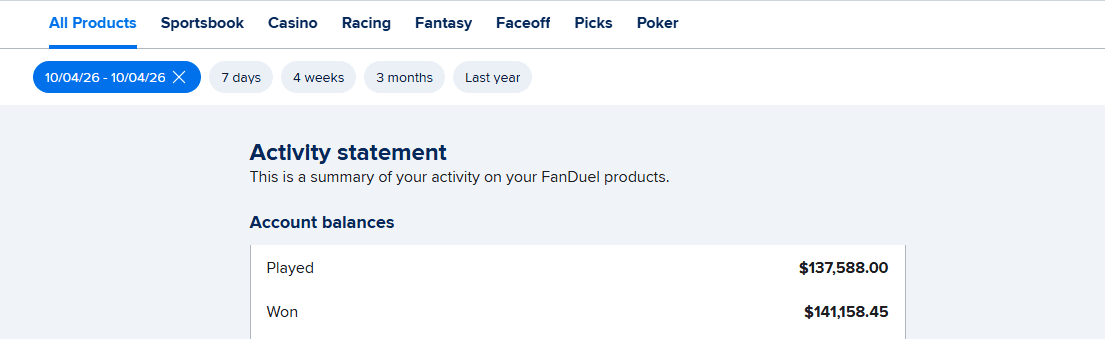
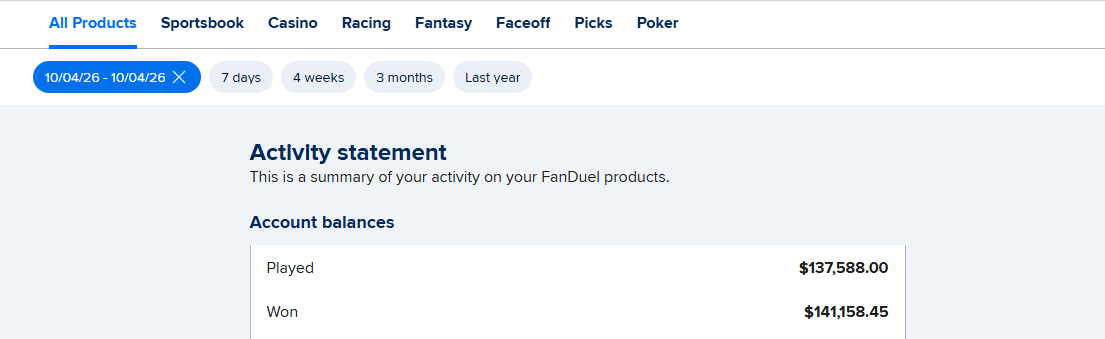
Bad NFL teams have not been bad bets against the spread. From 2002 through 2025, teams that had won 20 percent or fewer of their games, with at least five games played, covered 50.68 percent of the time across 894 games (445-433-16). The closing spread expected them to lose by 5.70 points and they lost by 6.28, close enough that the market priced them almost exactly. Teams with one win or fewer after six games covered 53.08 percent, and teams with an .800 record or better covered only 48.11 percent. The Best Bet on Sports has built a verified $367,520+ in profit across all sportsbooks over more than twenty years by testing handicapping rules like this one before using them.
Late October is when the NFL standings start to look settled. In 2026 the Chargers are 0-6, the Titans are 1-6 and just traded their best defender, the Dolphins are 1-5, and the Commanders are 1-4-1. At the other end, the Vikings are 6-0 and the 49ers 6-1.
Two opposite pieces of advice get repeated every year at this point. One says never bet on bad teams, because they find ways to lose. The other says always bet on bad teams, because the public will not touch them and the spread gets inflated. We tested both.
How Did We Test Bad NFL Teams Against the Spread?
We used the nflverse game file, which has closing spreads and final scores, for every regular-season game from 2002, the first season of the 32-team league, through 2025. For each team in each game, we calculated the team's straight-up record going into that game. We only counted games where the team had already played at least five games, so a 0-2 start does not count as a bad team.
Each team was graded against the closing spread. Pushes are removed from cover rates. The break-even rate at standard -110 pricing is 52.38 percent. Teams that relocated, such as the Raiders, Chargers and Rams, are tracked as one franchise.
This is different from our test of hot starts against the spread, which looked at a team's cover record. This study looks at the record that shows up in the standings: wins and losses.
Do Bad NFL Teams Cover the Spread?
About as often as everyone else. Here is every team-game from 2002 through 2025 with at least five games played, grouped by the team's winning percentage before kickoff.
| Winning percentage before the game | Team-games | ATS record | Cover rate | Average spread | Average margin | Straight-up win rate |
|---|---|---|---|---|---|---|
| .200 or lower | 894 | 445-433-16 | 50.68% | +5.70 | -6.28 | 33.22% |
| .201 to .400 | 2,209 | 1,105-1,044-60 | 51.42% | +3.03 | -3.07 | 40.43% |
| .401 to .600 | 2,769 | 1,282-1,397-90 | 47.85% | -0.63 | +0.31 | 50.60% |
| .601 to .800 | 2,114 | 1,058-996-60 | 51.51% | -3.22 | +3.92 | 61.40% |
| .801 or higher | 620 | 292-315-13 | 48.11% | -5.12 | +5.13 | 65.32% |
The spread column is from each team's side, so +5.70 means bad teams were 5.70-point underdogs on average. The margin column is what actually happened. Look at how close those two columns are in every row. The market expected the worst teams to lose by 5.70 and they lost by 6.28. It expected the best teams to win by 5.12 and they won by 5.13.
That is the main finding. The betting market already knows a team is bad. By late October, nobody is surprised that the Titans lose, and the spread says so.
One note on reading the table. Each game appears twice, once from each team's side, and the middle row includes many games between two average teams. The cover rates across rows are related to each other, so the 47.85 percent middle row is partly a mirror of the rows around it rather than its own angle.
What About Winless and Unbeaten Teams?
The extremes look the same as the bands.
| Situation, 2002-2025 | Team-games | ATS record | Cover rate | Average spread | Average margin |
|---|---|---|---|---|---|
| Winless after 4+ games | 221 | 111-108-2 | 50.68% | +6.53 | -6.52 |
| Unbeaten after 4+ games | 232 | 110-115-7 | 48.89% | -5.90 | +6.31 |
| One win or fewer after 6+ games | 432 | 224-198-10 | 53.08% | +6.19 | -6.22 |
| One loss or fewer after 6+ games | 405 | 193-202-10 | 48.86% | -5.24 | +5.28 |
Winless teams were expected to lose by 6.53 points and lost by 6.52. The market was off by one hundredth of a point. Unbeaten teams won by about 0.4 points more than expected but still covered less than half the time, because the average hides a lot of close wins that missed the number.
The one-win-or-fewer row is the closest thing to an angle in this study: 53.08 percent across 422 decided games, just above break-even. The plausible range on a sample that size runs from about 48.3 to 57.8 percent, so it is not strong enough to bet blind. It does settle the "never bet bad teams" advice. Over 24 seasons, betting the worst teams in football would have done slightly better than betting the best ones.
When Have Bad Teams Covered Best?
We split the worst teams, those at .200 or lower, several ways.
| Bad-team split, 2002-2025 | Team-games | ATS record | Cover rate |
|---|---|---|---|
| At home | 461 | 231-224-6 | 50.77% |
| On the road | 433 | 214-209-10 | 50.59% |
| Underdog of 7 or more | 390 | 205-175-10 | 53.95% |
| Underdog of 3 to 6.5 | 284 | 127-154-3 | 45.20% |
| Underdog under 3, or favored | 220 | 113-104-3 | 52.07% |
| Against a team at .601 or better | 263 | 136-123-4 | 52.51% |
| Weeks 5 through 10 | 452 | 227-216-9 | 51.24% |
| Weeks 11 through 14 | 267 | 130-132-5 | 49.62% |
| Week 15 or later | 175 | 88-85-2 | 50.87% |
Two results stand out. Bad teams getting 7 or more points covered 53.95 percent, while bad teams getting 3 to 6.5 covered only 45.20 percent. That split is interesting, but it is one of nine rows, and with that many splits one or two will look unusual by chance. We would not build a system on it.
The late-season rows matter more because they test a popular story. Many bettors believe bad teams quit or tank in December. Bad teams covered 50.87 percent from Week 15 on, no worse than in the middle of the season. The market prices motivation stories about as well as it prices records.
We also checked the most lopsided matchup, a team at .250 or worse facing a team at .750 or better, both with five or more games played. The bad team covered 54.55 percent of 165 decided games (90-75-2), as a 9.90-point underdog on average that lost by 9.83. Again the spread nearly matched the result, and the small cover edge is within normal variation for that sample.
Has the Bad-Team Edge Changed Over Time?
Yes. Whatever edge there was came early.
| Era | Teams at .200 or lower | Teams at .801 or higher |
|---|---|---|
| 2002-2009 | 53.56% (300 games) | 49.55% (226 games) |
| 2010-2017 | 48.63% (298 games) | 49.73% (190 games) |
| 2018-2025 | 49.83% (296 games) | 44.95% (204 games) |
From 2002 through 2009, bad teams covered 53.56 percent. Since 2010 they have covered below 50 percent. If there was once a market habit of overpricing losing records, it has been corrected.
The newest row shows the best teams covering only 44.95 percent since 2018. That is the largest gap in the study, and it matches what we found when we looked at hot starts: the market tends to move hardest toward the teams everyone is talking about. It is still one era of three on about 200 games, so we treat it as a caution about laying big numbers with elite teams, not a rule to fade them.
How Are Bad Teams Doing in 2026?
Through Thursday of Week 8, teams at .200 or worse with five or more games played are 6-3 against the spread in nine games, and teams at .800 or better are 0-4. Thirteen games is far too few to mean anything, but it is the same direction as the long-term data.
| Team | Record | ATS record | Point differential | Week 8 spread in dataset, Oct. 30 |
|---|---|---|---|---|
| Chargers | 0-6 | 0-5-1 | -61 | +6.5 at Rams |
| Titans | 1-6 | 3-4 | -48 | +12.5 at Bengals |
| Dolphins | 1-5 | 2-3-1 | -59 | +7 vs. Patriots |
| Commanders | 1-4-1 | 3-3 | -40 | -6 vs. Eagles |
The Commanders line is the best example of how the market really works. A 1-4-1 team is a six-point favorite over the 2-5 Eagles because Philadelphia lost Jalen Hurts for the season, a situation we covered in our Hurts injury and NFC East odds post. Spreads price the quarterback and the roster on the field this week, not the standings. The Titans line comes a few days after Tennessee sent Jeffery Simmons to Chicago, which we broke down in our Simmons trade betting impact post.
We are not posting a side on any of these games. The point of the table is that each spread already reflects the record, and the long-term data says that is about the right amount.
Why Does This Matter When You Pay for Picks?
Because "fade the bad team" and "back the bad team" are both reasons a pick service might give for a play, and neither is an edge. If a handicapper's pick write-up leans on a team's record, ask what the spread already says about that record. Over 24 seasons, it said almost exactly the right thing.
That is also why we test angles like bounce-backs after blowouts and turnover-driven losses before we use them, and why most of them do not make our card. Our NFL picks against the spread and NFL expert picks are built on what teams are doing on the field, and every result is posted on our results page.
If you are comparing a sports handicapping service or thinking about whether to pay for sports picks at all, ask each service which of its rules it has tested against the closing spread. Our football handicappers page explains how we approach the weekly card. With the NBA season under way, our basketball handicappers page shows how the same testing applies when a basketball team is losing early in the season.
Get Tonight's Live Picks
Want tonight's live in-game NFL picks, built on how each team is actually playing rather than on its record, delivered to your phone during the game?
The Best Bet on Sports is the only live betting handicapping service limited on all six major U.S. sportsbooks (FanDuel, DraftKings, Caesars, BetMGM, Fanatics, ESPN BET) for winning too much during in-game action. Verified profit: $367,520+. Picks delivered via Email and Discord during games.
→ Get tonight's live picks: $199 first month — 1-Unit package, full live betting access → Try a live pick first — reserve your spot for tonight's pick
You can also browse our NFL picks or our football betting picks.

Frequently Asked Questions
Do bad NFL teams cover the spread?
About half the time. From 2002 through 2025, teams that had won 20 percent or fewer of their games, with at least five games played, covered 50.68 percent of 894 games against the closing spread. The spread expected them to lose by 5.70 points and they lost by 6.28.
Should you bet against winless NFL teams?
Not on record alone. Teams that were winless after four or more games covered 50.68 percent of 221 games from 2002 through 2025. The spread expected them to lose by 6.53 points, and they lost by 6.52, so the market had already priced their record almost exactly.
Do undefeated NFL teams cover the spread?
Slightly less than half the time. Teams that were unbeaten after four or more games covered 48.89 percent from 2002 through 2025, and teams with an .800 record or better covered 48.11 percent. Since 2018, teams at .800 or better have covered 44.95 percent of about 200 games.
Do bad NFL teams quit late in the season?
Not in a way that shows up against the spread. From 2002 through 2025, teams with a .200 record or worse covered 50.87 percent from Week 15 on, compared with 51.24 percent from Week 5 through Week 10. The market prices late-season motivation stories well.
Are big underdogs with bad records a good bet?
They have done slightly better than average. Teams at .200 or worse that were underdogs of 7 or more points covered 53.95 percent of 380 decided games from 2002 through 2025. It was one of nine splits we tested, so treat it as a lean, not a system.
Which NFL teams have the worst records in 2026?
Through Thursday of Week 8, the Chargers are 0-6, the Titans 1-6, the Dolphins 1-5 and the Commanders 1-4-1. Teams at .200 or worse with five or more games played are 6-3 against the spread this season, a sample too small to read as a trend.
Why are bad NFL teams not automatic fades?
Because the spread already reflects their record. Across 24 seasons, the average closing spread for the worst teams was within 0.6 points of their actual average margin. Fading them only works when you know something the spread does not, such as how the team is playing in a given game.
The Best Bet on Sports · 1.5M followers on TikTok
Sports Betting TikTok is the live betting account behind The Best Bet on Sports, covering NFL, NCAAF, NBA, NCAAB, MLB and WNBA markets in real time. The account has been limited on all six major U.S. sportsbooks — FanDuel, DraftKings, Caesars, BetMGM, Fanatics and ESPN BET — for winning on live betting, with $367,520 in verified profit since 2005. View full profile →
Past results do not guarantee future performance. Must be 21 or older to wager.
Related Articles
NFL Cross-Country Trips, Tested
NFL Letdown Spots, Tested
NFL Division Revenge Games, Tested
First-Year NFL Coaches ATS, Tested
4-0 Against the Spread: What a Hot Start Predicts
The Bye-Week Edge, Tested on 11 NFL Seasons
Get real live betting picks
From $39.95/mo · Cancel anytime · Email + Discord delivery
● Get The Picks
Choose your package
Tap any tier below to select · Subscribe in one tap
👇 Tap any package to select it
✓ You're selecting
25 Units · $99.95/month
25 unit picks per month. Sweet spot for most bettors — plenty of action without going all-in.
- ✓25 live betting selections/month
- ✓Email + Discord delivery
- ✓All sports (NFL, NCAAF, NBA, NCAAB, MLB)
- ✓Mix of 1, 2, 3, 5-unit rated plays
- ✓Cancel anytime
Secure PayPal · Cancel anytime · No hidden fees · 21+ · +$367K verified
+$367,520 verified · Limited on 6 sportsbooks · 20 years documented · See Proof
Join Our Newsletter
Get free expert sports picks and analysis delivered weekly.