Buy Teams After a Turnover Disaster? ATS Tested

Buying NFL teams after a turnover disaster has not worked against the spread. From 2015 through 2025, teams coming off a game with a turnover margin of minus three or worse covered 47.56 percent of 431 next games. Turnover margin barely carries over from one week to the next, but the market already knows that, so the bad-luck team is not underpriced.
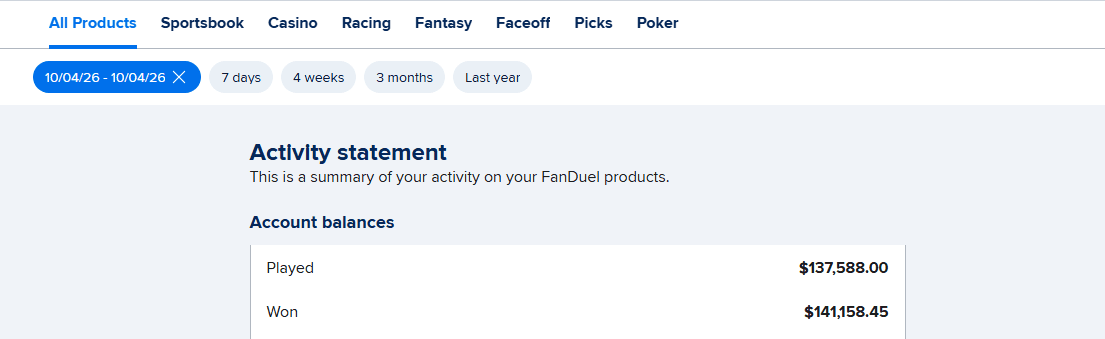
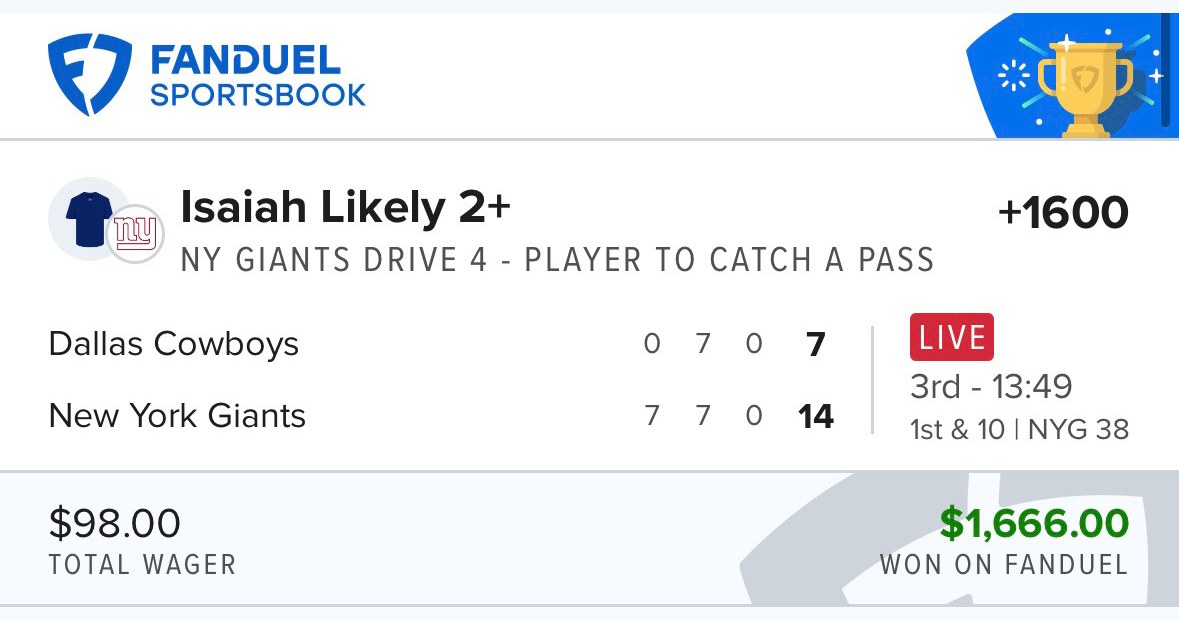
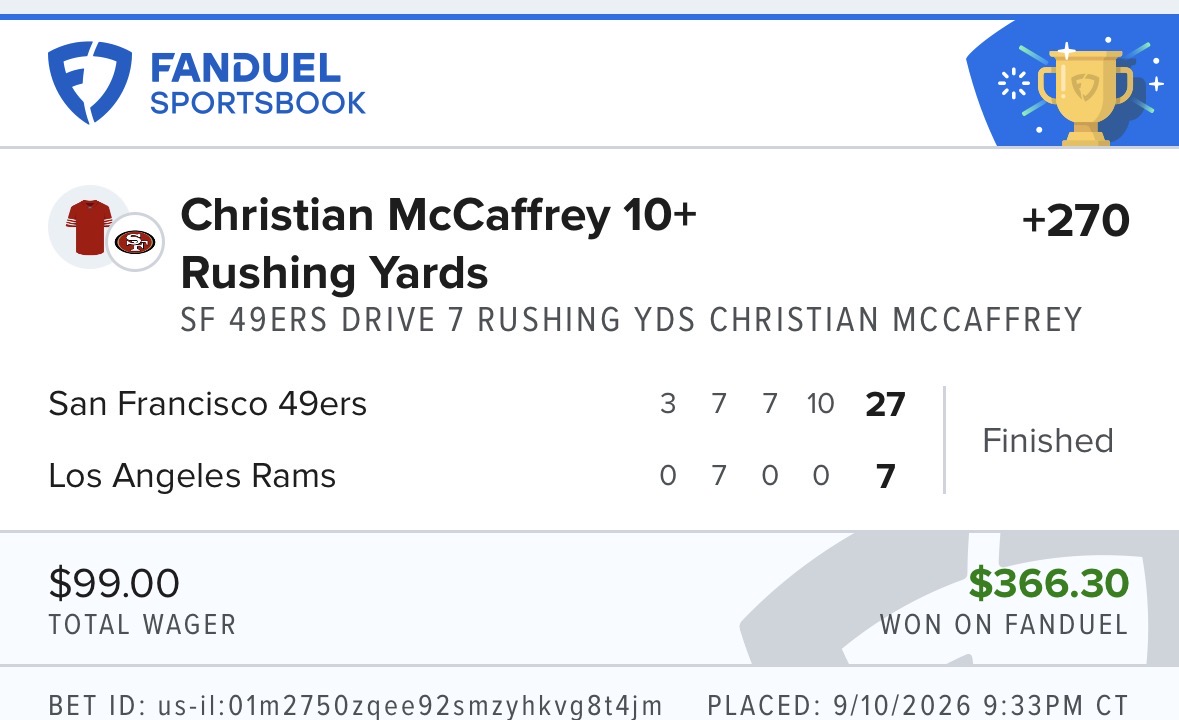
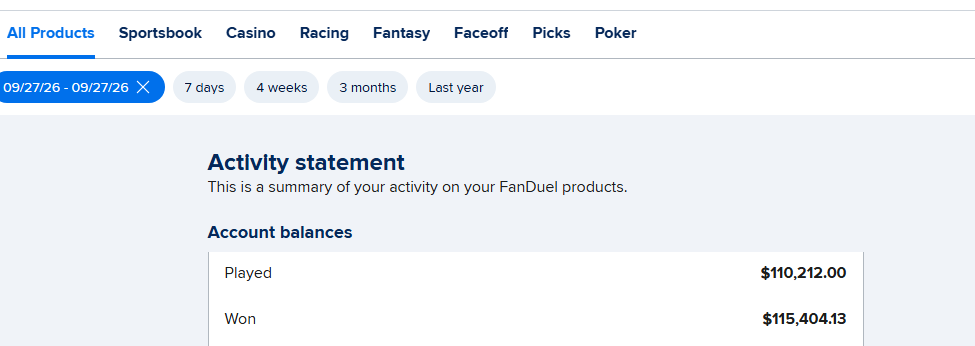
Buying NFL teams after a turnover disaster is one of the most repeated "smart money" rules in football, and eleven seasons of data say it has not paid. From 2015 through 2025, teams coming off a game where they lost the turnover battle by three or more covered only 47.56 percent of 431 next games against the closing spread. The premise behind the rule is true: turnover margin is close to random from week to week. The market simply priced that in. The Best Bet on Sports has built a verified $367,520+ in profit across all sportsbooks over more than twenty years by testing rules like this one before betting them.
The logic sounds airtight. Turnovers are noisy. A team that coughs it up four times on Sunday is not a four-turnover team; it had a bad day. The public sees a blowout loss and bails. The sharp bettor buys the team at a discount the following week.
Every step of that story is reasonable. This post checks whether the last step, the discount, actually exists. It matters if you are paying for NFL picks against the spread, because "buy low after turnovers" is a staple of weekly write-ups.
How Was the Study Built?
We used the nflverse play-by-play files for every regular-season game from 2015 through 2025 and counted each team's interceptions thrown and fumbles lost. A team's turnover margin for a game is the turnovers it forced minus the turnovers it gave away. Turnovers on downs were not counted.
We then looked at each team's next regular-season game in the same season and graded it against the closing point spread at the listed closing price, using -110 where no price was recorded. Pushes were removed. That left 5,298 team-games with a prior game to compare.
Each rate was resampled 2,000 times to estimate a plausible range.
Is Turnover Margin Really Random From Week to Week?
Close to it, yes.
The correlation between a team's turnover margin in one game and its margin in the next was 0.024. That is effectively zero. Teams that finished minus three or worse averaged a turnover margin of +0.005 in their following game, which is dead even. Teams that finished plus three or better averaged +0.116 the next week.
So the first half of the rule holds. A team that just turned it over four times is not likely to do it again. The bad week really was mostly bad luck, at least in the turnover column.
It also had a big effect on the scoreboard. Teams that lost the turnover battle by three or more won only 8.4 percent of those games, lost by an average of 14.22 points, and missed the spread by 12.91 points on average. That is the kind of result that makes a team look broken.
Do Teams Cover After Losing the Turnover Battle?
No. They did slightly worse than average.
| Previous game turnover margin | Next games | ATS record | Cover rate | Return per $1 |
|---|---|---|---|---|
| -4 or worse | 122 | 59-63 | 48.36% | -7.15% |
| -3 | 309 | 146-163 | 47.25% | -8.81% |
| -2 | 596 | 306-290 | 51.34% | -0.47% |
| -1 | 1,020 | 494-526 | 48.43% | -5.97% |
| Even | 1,214 | 608-606 | 50.08% | -2.74% |
| +1 | 1,016 | 515-501 | 50.69% | -1.69% |
| +2 | 589 | 305-284 | 51.78% | +0.65% |
| +3 | 308 | 154-154 | 50.00% | -3.02% |
| +4 or better | 124 | 61-63 | 49.19% | -4.55% |
Combining the bottom two rows, teams at minus three or worse went 205-226 against the spread, a 47.56 percent cover rate that lost 8.34 cents per dollar. The plausible range ran from 42.7 to 52.7 percent. Teams at plus three or better went 215-217, 49.77 percent.
Neither extreme produced an edge. The middle of the table is a coin flip, and so are both ends.
What About Teams That Lost Because of the Turnovers?
This is the purest version of the rule: a team that lost the game and gave away the turnover battle in a big way. If the market overreacts to anything, it should be this.
| Spot | Next games | ATS record | Cover rate | Return per $1 |
|---|---|---|---|---|
| Minus 3 or worse, lost the game | 393 | 182-211 | 46.31% | -10.83% |
| Minus 3 or worse, lost by 1 to 8 | 115 | 52-63 | 45.22% | -13.19% |
| Minus 3 or worse, missed the spread by 7+ | 297 | 147-150 | 49.49% | -4.72% |
| Minus 3 or worse, won anyway | 36 | 22-14 | 61.11% | +18.31% |
The teams that lost a close game while bleeding turnovers, the classic "they should have won" spot, covered only 45.22 percent the next week. The one group that covered well was the small set of teams that won despite losing the turnover battle by three, and 36 games is far too few to bet on. Its plausible range ran from 44.4 to 77.8 percent.
Does the Next Line Make a Difference?
The rule usually comes with a picture of the team getting points the following week. That version held up better than the alternative.
Teams at minus three or worse that were underdogs in their next game went 125-122 against the spread, 50.61 percent. Teams in the same spot that were favorites the next week went 79-103, only 43.41 percent, with a plausible range of 36.3 to 50.5 percent.
One reading is that the market did not discount these favorites enough after the ugly game, but the more honest reading is that this is one of more than a dozen slices we checked. It leans toward fading the favorite, not buying the team, which is the opposite of the rule.
Why Doesn't the Turnover Bounce-Back Work?
Because "turnovers are random" is not a secret.
Every serious power rating discounts turnover luck. Sportsbooks know a fumble-filled loss says little about next week, and so do the bettors whose money moves the closing number. By the time the line closes, the bad-luck team has already been priced as roughly the team it was before the disaster. The market is not ignoring the regression; it is the reason the regression is already in the number.
That is the gap between a true fact and an edge. Turnovers do regress. The closing spread regresses them for you. A handicapper betting the rule is paying the vig to agree with the market.
Did the Rule Ever Work?
For a while, it looked like it worked in reverse.
From 2015 through 2019, teams coming off a minus-three game went 78-123 against the spread, a 38.8 percent cover rate. Fading them was the profitable side. From 2020 through 2025, the same spot went 127-103, 55.2 percent, and buying them would have won.
A bettor who started in 2016 learned to fade these teams. A bettor who started in 2021 learned to buy them. Both were following a real pattern for a few seasons, and both would have been wrong over the full eleven years. That swing is exactly why a rule needs a long sample before anyone should pay for it.
So far in 2026, through Thursday night of Week 7, there have been ten such spots. Those teams are 4-6 against the spread, which tells us nothing yet.
How Should You Handicap a Team Coming Off a Turnover Disaster?
Do not bet the bounce-back on the label alone. Minus three or worse covered 47.56 percent the next week. The rule is a coin flip with a vig attached.
Ask why the turnovers happened. A tipped interception and an overthrown screen are noise. A quarterback under pressure on every dropback is a problem that will still be there next Sunday. The turnover count treats them the same, and so does the rule.
Watch the role in the next game. Underdogs coming off the disaster covered at an ordinary rate. Favorites coming off it covered 43.41 percent. That is not strong enough to bet blindly, but it is a reason not to lay points with a team just because its last game looked unlucky.
Be skeptical of any rule with a hot streak. This one went 78-123 for five years and then 127-103 for six. A rule that flips sides is not a rule. We found the same pattern when we tested rookie quarterbacks against the spread.
Why This Matters If You Pay for Picks
A sports handicapping service charges you for the spots the market has wrong. "Buy the team that turned it over" is a spot the market has known about for years.
When you look at NFL expert picks, notice how often the reasoning leans on a turnover narrative. Ask how the angle performed over a decade, not over a few weeks. Before you pay for sports picks, a serious service should be able to tell you where an idea failed as well as where it worked.
What Are the Limits of This Study?
Turnovers here are interceptions thrown and fumbles lost. We did not separate tipped passes, fumbles on special teams or Hail Mary interceptions, and we did not count turnovers on downs.
Results use closing spreads and closing prices. Bettors who got an earlier line, before the market finished adjusting, may have seen different results. Opening lines were not part of this data.
We checked more than a dozen slices. Every number here describes what happened from 2015 through 2025, not what is promised to repeat.
Get Tonight's Live Picks
Want tonight's live in-game picks, built on what is actually happening on the field rather than on last week's box score, delivered to your phone during the game?
The Best Bet on Sports is the only live betting handicapping service limited on all six major U.S. sportsbooks (FanDuel, DraftKings, Caesars, BetMGM, Fanatics, ESPN BET) for winning too much during in-game action. Verified profit: $367,520+. Picks delivered via Email and Discord during games.
→ Get tonight's live picks: $199 first month — 1-Unit package, full live betting access → Try a live pick first — reserve your spot for tonight's pick
See every package on buy sports picks, browse this week's NFL picks, or, if basketball is your sport, read how our basketball handicappers approach the new NBA season.
Frequently Asked Questions
Do NFL teams cover the spread after losing the turnover battle?
Not more often than average. From 2015 through 2025, teams coming off a game with a turnover margin of minus three or worse went 205-226 against the closing spread in their next game, a 47.56 percent cover rate. That returned -8.34 percent per dollar at closing prices.
Is turnover margin random from week to week in the NFL?
Very close to it. The correlation between a team's turnover margin in one game and its margin in the next was 0.024 from 2015 through 2025. Teams that finished minus three or worse averaged a turnover margin of +0.005 the following week, essentially even.
Is buying teams after a bad turnover game a profitable strategy?
No. Over eleven seasons, the bounce-back spot covered 47.56 percent, below the 52.38 percent needed to break even at standard -110 pricing. Teams that lost a close game while losing the turnover battle by three or more covered only 45.22 percent the next week.
Why doesn't the turnover regression show up against the spread?
Because the betting market already expects it. Sportsbooks and sharp bettors discount turnover luck when they set and move the line, so a team coming off a fumble-filled loss is priced close to how it was rated before that game. The regression happens on the field, but the closing spread has already accounted for it.
Has fading teams after turnovers ever worked?
For a stretch, yes. From 2015 through 2019, teams coming off a minus-three turnover game went 78-123 against the spread, so fading them won. From 2020 through 2025, the same spot went 127-103, so buying them won. Over the full eleven seasons, neither side cleared break-even.
How often do teams lose when they are minus three in turnovers?
Almost always. From 2015 through 2025, teams that lost the turnover battle by three or more won only 8.4 percent of those games, lost by an average of 14.22 points, and missed the closing spread by 12.91 points on average.
Are favorites coming off a turnover disaster a good bet?
The data leans against them. Teams that were minus three or worse in turnovers and then favored in their next game went 79-103 against the spread from 2015 through 2025, a 43.41 percent cover rate. Teams in the same spot that were underdogs went 125-122, 50.61 percent.
The Best Bet on Sports · 1.5M followers on TikTok
Sports Betting TikTok is the live betting account behind The Best Bet on Sports, covering NFL, NCAAF, NBA, NCAAB, MLB and WNBA markets in real time. The account has been limited on all six major U.S. sportsbooks — FanDuel, DraftKings, Caesars, BetMGM, Fanatics and ESPN BET — for winning on live betting, with $367,520 in verified profit since 2005. View full profile →
Past results do not guarantee future performance. Must be 21 or older to wager.
Related Articles
Should You Fade Rookie QBs Against the Spread? Tested
Moneyline or Spread on NFL Favorites? 11 Years Tested
NFL Bounce-Back Spots After a Blowout, Tested
4-0 Against the Spread: What a Hot Start Predicts
The Bye-Week Edge, Tested on 11 NFL Seasons
NFL Referee Over/Under Trends, Tested on 11 Seasons
Get real live betting picks
From $39.95/mo · Cancel anytime · Email + Discord delivery
● Get The Picks
Choose your package
Tap any tier below to select · Subscribe in one tap
👇 Tap any package to select it
✓ You're selecting
25 Units · $99.95/month
25 unit picks per month. Sweet spot for most bettors — plenty of action without going all-in.
- ✓25 live betting selections/month
- ✓Email + Discord delivery
- ✓All sports (NFL, NCAAF, NBA, NCAAB, MLB)
- ✓Mix of 1, 2, 3, 5-unit rated plays
- ✓Cancel anytime
Secure PayPal · Cancel anytime · No hidden fees · 21+ · +$367K verified
+$367,520 verified · Limited on 6 sportsbooks · 20 years documented · See Proof
Join Our Newsletter
Get free expert sports picks and analysis delivered weekly.