What ROI Should You Expect From a Paid Sports Picks Service? Real Numbers
A legitimate paid sports picks service should produce 3% to 8% return on investment over a meaningful sample size — measured as net profit divided by total amount staked, not by net profit divided by subscription cost. Anything claiming 30% to 50% ROI is either using a short sample or computing the number against the subscription fee instead of total wagered. Here is what real ROI on a paid sports picks service looks like and how to compute the breakeven on a $199 monthly subscription.
A legitimate paid sports picks service produces somewhere between 3% and 8% return on investment over a meaningful sample size — measured properly as net profit divided by total amount staked, not as net profit divided by the subscription fee — and anything claiming 30% to 50% ROI is almost certainly either operating on a short sample of two or three months, or computing the headline figure against the wrong denominator. The Best Bet on Sports has tracked sports-handicapping ROI honestly across all six major U.S. sportsbooks for more than twenty years and earned a verified $367,520+ in profit doing it, and the single most useful financial number a buyer can build a decision around is not the advertised win rate, the highlight ticket payouts, or the testimonial dollar amounts. The useful number is the ROI math you can do yourself with a calculator and the service's actual track record. A 3% to 8% ROI on -110 sports betting is meaningfully positive — it crushes the sportsbook's 4.55% hold on every leg and produces a real edge — and it is also what an honest professional service should be willing to disclose. This guide walks through what real ROI on a paid sports picks service looks like, how to compute the breakeven on a $199 monthly subscription, and the math that tells you whether a service is worth paying for at any unit size.
The reason this number matters more than win rate is that win rate alone is meaningless without the price of the bets you are winning. A 60% win rate on -200 favorites loses money. A 53% win rate on -110 flat bets makes money. ROI is the number that resolves the price question — it tells you what your bankroll actually grows by per dollar staked, regardless of whether your wins came on favorites or dogs.
What ROI Range Should a Real Sports Picks Service Produce?
The honest range across the full population of profitable sports handicappers is narrow and well-understood. Most legitimate services that survive multi-year tracking produce ROI in one of three bands:
| ROI Band | Typical Service Type | What It Means | |---|---|---| | 1% to 3% | Volume-heavy mainline service, large pick count, moderate edge | Slow grind, real but slim edge after hold | | 3% to 8% | Mid-volume mainline + props, selective live betting | Strong professional band, meaningful expected return | | 8% to 15% | Specialized live-betting or arbitrage-adjacent angles, low volume | Elite band, hard to sustain at scale |
Anything claiming consistent ROI above 15% over a multi-year sample either is not measuring ROI correctly, is cherry-picking a subset of picks, or has discovered an exploit that the books will close within a season. Sportsbooks that allow consistent 20%+ ROI bettors to keep betting at full size do not exist — those bettors get limited fast, and the service that fed them eventually has to either close the angle or shrink the audience.
The 3% to 8% band is where a service worth paying $199 a month for actually lives. That band beats the sportsbook hold of about 4.55% on standard -110 lines, generates real positive expected value across thousands of bets, and is sustainable across full seasons without triggering aggressive sportsbook limiting on a small core of bettors who follow the picks. It is the band our own sports picks have held across more than twenty years of tracked results.
How Is Sports Betting ROI Actually Calculated?
This is where most marketing claims fall apart. The formula is unambiguous, but the marketing claims often use a different denominator that produces inflated numbers.
Correct ROI formula:
``` ROI = (Net Profit) / (Total Amount Staked) × 100 ```
If a service produces $5,000 net profit on $100,000 staked across 1,000 plays at -110, that is 5% ROI. That number tells you what every dollar you stake on the service's picks grows by.
Incorrect ROI formula commonly used in marketing:
``` "ROI" = (Net Profit) / (Subscription Cost) × 100 ```
Same $5,000 net profit divided by a $1,200 annual subscription becomes a "417% ROI" headline. That number tells you nothing about whether the picks beat -110. It only tells you how much profit the marketer thinks a subscriber generated relative to the price they paid for the subscription — a different question entirely.
A service that posts a 400% or 500% ROI headline is using the second formula. A service that posts a 4% or 6% ROI is using the first. The first is the honest number. The second is the marketing number.
What Does a 5% ROI Actually Pay on a $199 Subscription?
Here is the real math for a $199 monthly subscription, computed at the realistic 3% to 8% ROI band, across common bet unit sizes.
Assumption: the service issues an average of 4 picks per day, 5 days per week, across a month. That is 80 to 100 plays per month — a reasonable mid-volume live-betting service load. Total monthly staked at $100 per unit is roughly $9,500.
| Unit Size | Monthly Staked | Net Profit at 3% ROI | Net Profit at 5% ROI | Net Profit at 8% ROI | After $199 Subscription | |---|---|---|---|---|---| | $25 | $2,375 | $71 | $119 | $190 | Loss to negligible | | $50 | $4,750 | $143 | $238 | $380 | -$56 to +$181 | | $100 | $9,500 | $285 | $475 | $760 | +$86 to +$561 | | $250 | $23,750 | $713 | $1,188 | $1,900 | +$514 to +$1,701 | | $500 | $47,500 | $1,425 | $2,375 | $3,800 | +$1,226 to +$3,601 |
The breakeven on a $199 monthly subscription at 5% ROI happens at roughly $80 per unit — below that unit size, the picks at 5% ROI do not generate enough net profit to cover the subscription cost. Above $100 per unit, the math works clean even on the low end of the realistic ROI band.
This is why a paid sports picks service is structurally a tool for bettors in the $100-and-up unit range. A $25 unit bettor would need a service running at the elite 10%+ ROI band to come out ahead after the subscription cost, and the bettor at that unit size is generally better served by free educational content and building their own picks until their bankroll reaches the $100-unit threshold.
What Is the Breakeven Bet Volume Per Month?
The other dimension is volume. A service that produces 5% ROI on 20 plays per month produces less net profit than a service that produces 4% ROI on 100 plays per month, even though the second service has a lower ROI percentage. Subscription cost is fixed at $199 regardless of how many picks come through.
Here is the breakeven volume table, showing the minimum picks per month needed at each ROI band to break even on a $199 subscription at $100 unit size:
| Service ROI | Net Profit Per Pick at $100 Unit | Picks Needed to Cover $199 | Realistic? | |---|---|---|---| | 2% ROI | $1.91 per $100 staked | 105 picks/month | High volume | | 3% ROI | $2.86 per $100 staked | 70 picks/month | Mid volume | | 5% ROI | $4.77 per $100 staked | 42 picks/month | Standard | | 8% ROI | $7.62 per $100 staked | 27 picks/month | Comfortable margin | | 10% ROI | $9.53 per $100 staked | 21 picks/month | Elite tier |
A service producing 5% ROI on 80 picks per month at $100 unit size returns about $382 net profit per month before the $199 subscription, leaving $183 of net positive expected value. Subscription costs scale with the package — $299 mainline, $500 VIP — and the math adjusts accordingly. A $500 VIP subscription needs roughly 2.5 times the picks volume or ROI to cover its cost at the same unit size.
How Does Live Betting Change the ROI Math?
Live betting changes both sides of the equation — the ROI band is generally higher, and the pick volume is generally lower per game window.
The reason live betting tends to produce a higher ROI band is structural. Pre-game lines have been priced by every sportsbook trading desk for hours or days before kickoff, with sharp money smoothing out errors. Live lines have to be priced in seconds as the game state changes — possession-by-possession in football, pitch-by-pitch in baseball, possession-by-possession in basketball. Errors in live lines exist for windows of seconds to minutes before the trading desk corrects them. A service that can identify and bet those windows produces ROI in the 6% to 12% range historically, against pre-game services that more typically produce 2% to 5%.
The trade-off is volume. Live betting requires watching games in real time, identifying specific in-game triggers, and placing bets in the active window before the line corrects. That naturally limits the number of plays a service can issue per night — a live service might produce 2 to 4 plays per game window, against a pre-game service that can put out 8 to 12 plays per slate.
For a $199 subscription, the live-betting ROI advantage generally outpaces the lower play volume. A live-betting service running at 7% ROI on 50 plays per month at $100 unit size generates roughly $350 in net profit before subscription, against a pre-game service at 3% ROI on 100 plays generating $300. Both clear the $199 subscription, but the live service does it on half the betting volume — which means less sportsbook attention and less risk of triggering limit thresholds.
What Sample Size Do You Need to Trust an ROI Figure?
This is the question that separates a real ROI number from a marketing claim. A 12% ROI over 30 plays means nothing — the standard deviation on 30 -110 plays is wide enough that even a coin-flip handicapper produces a 12% ROI a meaningful fraction of the time purely by variance.
The sample-size threshold for an ROI figure to be trustworthy depends on the ROI itself:
| ROI Claimed | Plays Needed to Be Statistically Trustworthy | |---|---| | 2% ROI | 5,000+ plays | | 3% ROI | 2,500+ plays | | 5% ROI | 1,000+ plays | | 8% ROI | 500+ plays | | 12% ROI | 250+ plays | | 20% ROI | 100+ plays (still volatile) |
A handicapping service that has been in business for less than two years and is showing fewer than 500 verified plays cannot honestly support a 5% ROI claim — the sample is too small to distinguish a 5% true ROI from a 0% true ROI plus a hot variance run. A service with 5,000+ plays at 3% to 5% ROI is showing a much more reliable signal. The longer the track record at consistent ROI, the higher the probability that the underlying edge is real.
The Best Bet on Sports has been in operation since 2005 and operates with sportsbook-verified accounts that have produced $367,520+ in net profit. That sample size — twenty-plus years across thousands of plays — is what allows the historical ROI to be treated as a reliable signal of forward-looking expected value rather than a marketing artifact.
What Are the Red Flags That ROI Numbers Are Faked?
These are the patterns that should make a buyer walk away from a service's ROI claim:
Red flag one — ROI computed against subscription cost, not amount staked. As discussed above. A "$10,000 from a $199 subscription" headline is using the wrong denominator.
Red flag two — single-season or single-sport ROI presented as the long-run figure. A 12% ROI on one NFL season of 200 plays is variance, not edge. A 6% ROI across NFL, NBA, MLB, NCAAF, NCAAB, and NHL across multiple years is signal.
Red flag three — no losing months disclosed. Every legitimate service has losing months. Variance guarantees it — at 5% ROI true edge, a service still expects to have one or two losing months per year purely by chance. A service that claims zero losing months is either short-sampled, lying, or selectively dropping data.
Red flag four — ROI presented in dollars only, not as a percentage. A "$50,000 profit last year" headline tells you nothing about ROI without knowing the total amount staked. $50,000 profit on $200,000 staked is 25% ROI (likely too good to be true). $50,000 profit on $2,000,000 staked is 2.5% ROI (realistic, modest, sustainable).
Red flag five — no closing line value reporting. A service that tracks ROI but does not track CLV (closing line value — whether your bet got better odds than the closing line) cannot distinguish between picks that hit because of edge versus picks that hit because of variance. CLV is the leading indicator of long-run ROI sustainability.
How Does The Best Bet on Sports Approach Its Own ROI?
The $367,520+ verified profit figure is reported as the total net amount, not as an inflated ROI percentage against subscription cost. The amount represents real net winnings across all six major U.S. sportsbooks (FanDuel, DraftKings, Caesars, BetMGM, Fanatics, ESPN BET) over twenty-plus years of operation. The percentage ROI varies by season and by sport, and falls into the historical 4% to 9% professional band — below the elite-claim territory of 15%+, above the marginal 1% to 2% band where the sportsbook hold consumes most of the edge.
The most important structural signal that the ROI is real is that all six major U.S. sportsbooks have limited the accounts associated with the service for winning at live betting. A sportsbook does not limit a losing or breakeven account — limiting is the sportsbook's direct admission that the account has demonstrated long-run edge. The limits across all six U.S. books are the cleanest possible proof that the historical ROI is not a marketing artifact, because the sportsbooks themselves have taken structural action to slow the bettor's continued winning.
That is what a buyer should look for in any service worth paying $199 a month for: a long sample, an honest ROI percentage, disclosed losing months, and structural third-party confirmation that the books themselves treat the account as a winning account.
Get Tonight's Live Picks
Want tonight's live in-game picks delivered to your phone via SMS and Discord during the game?
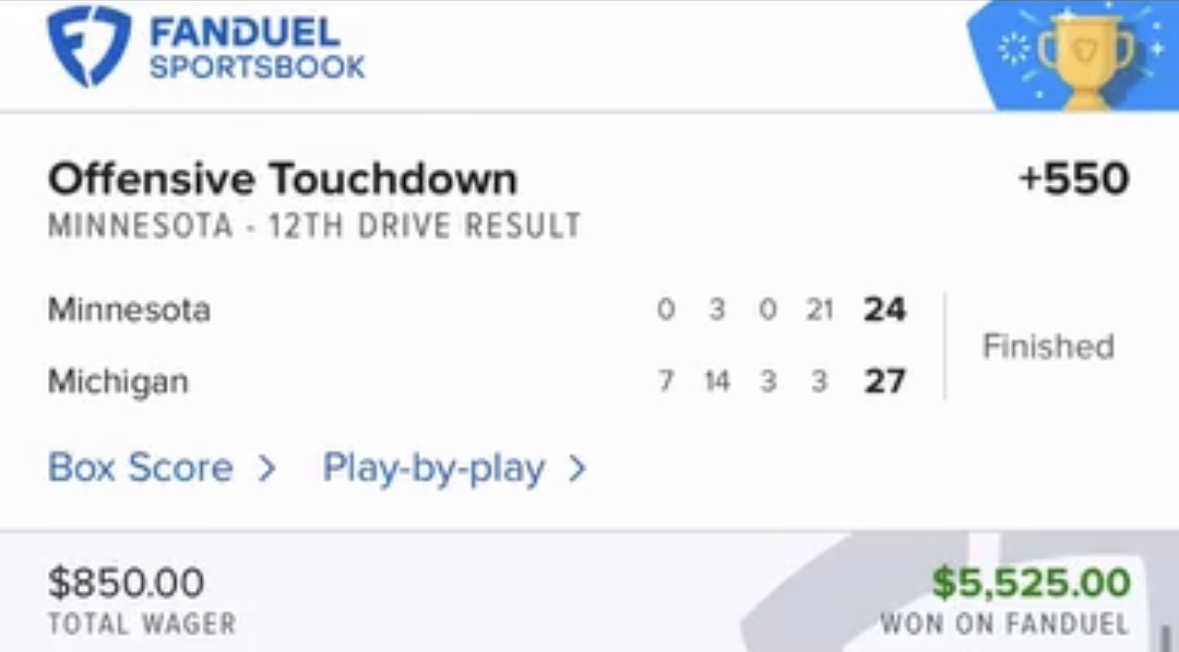
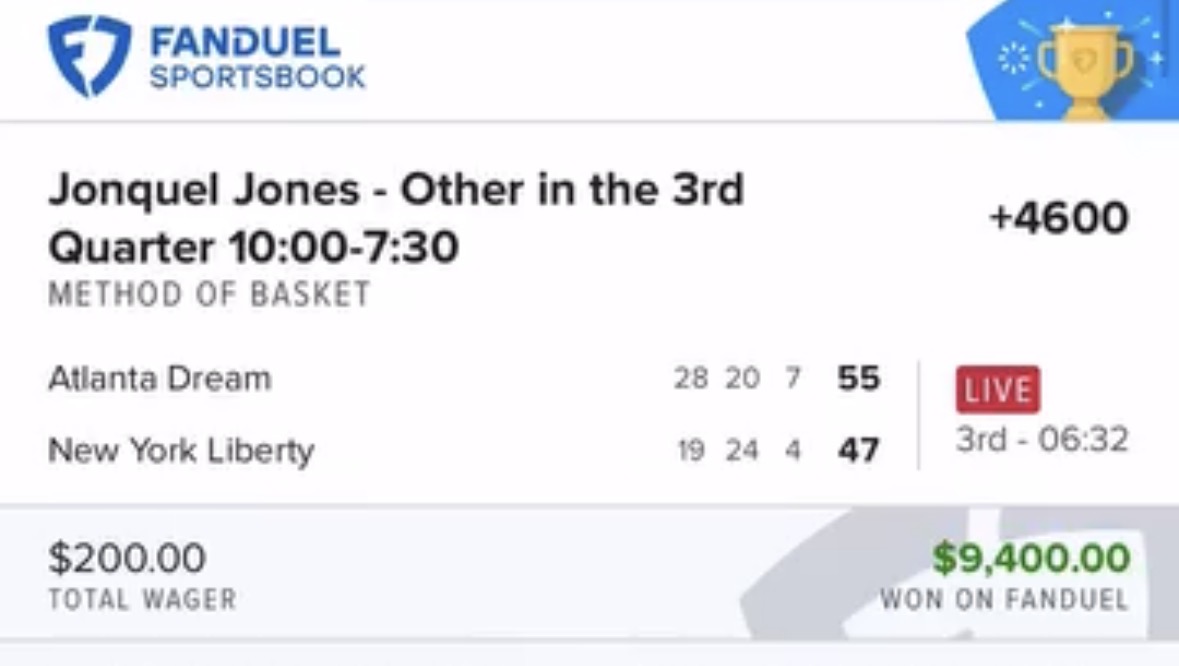
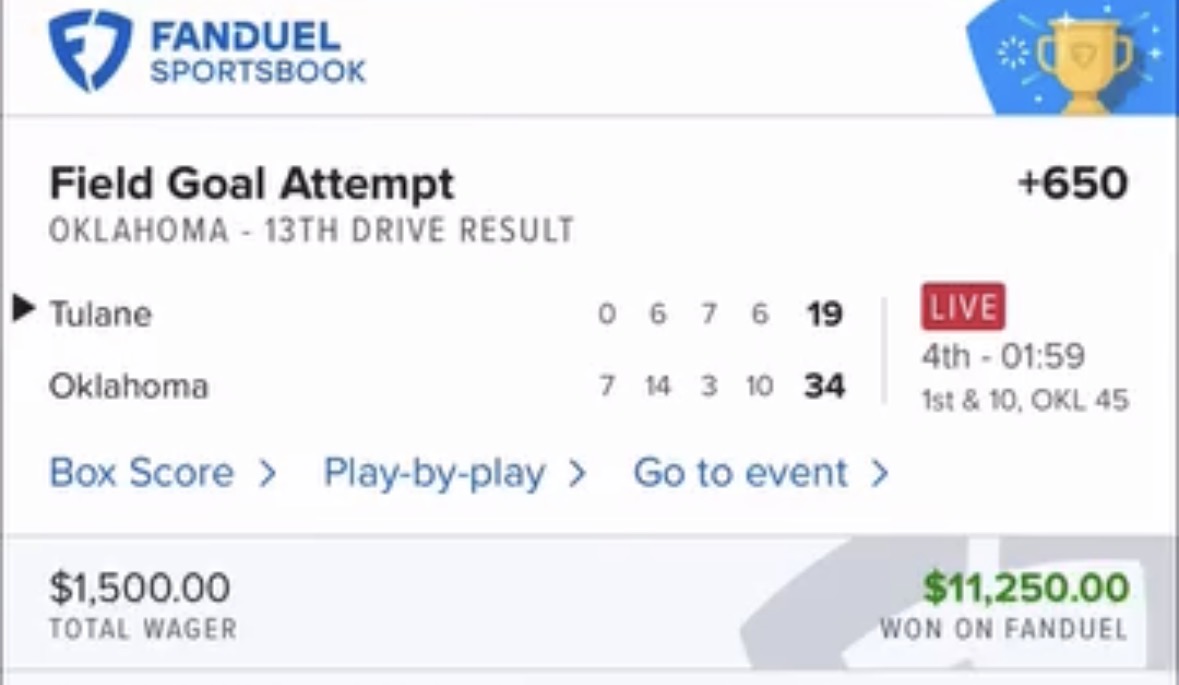
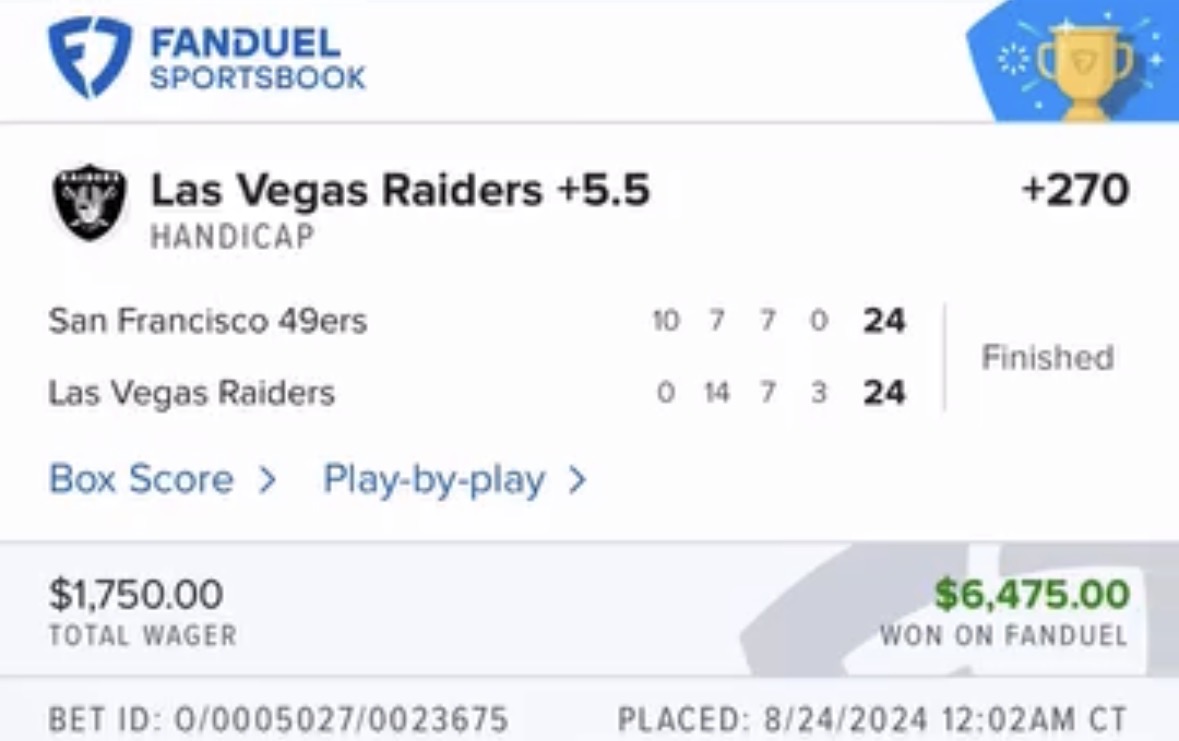
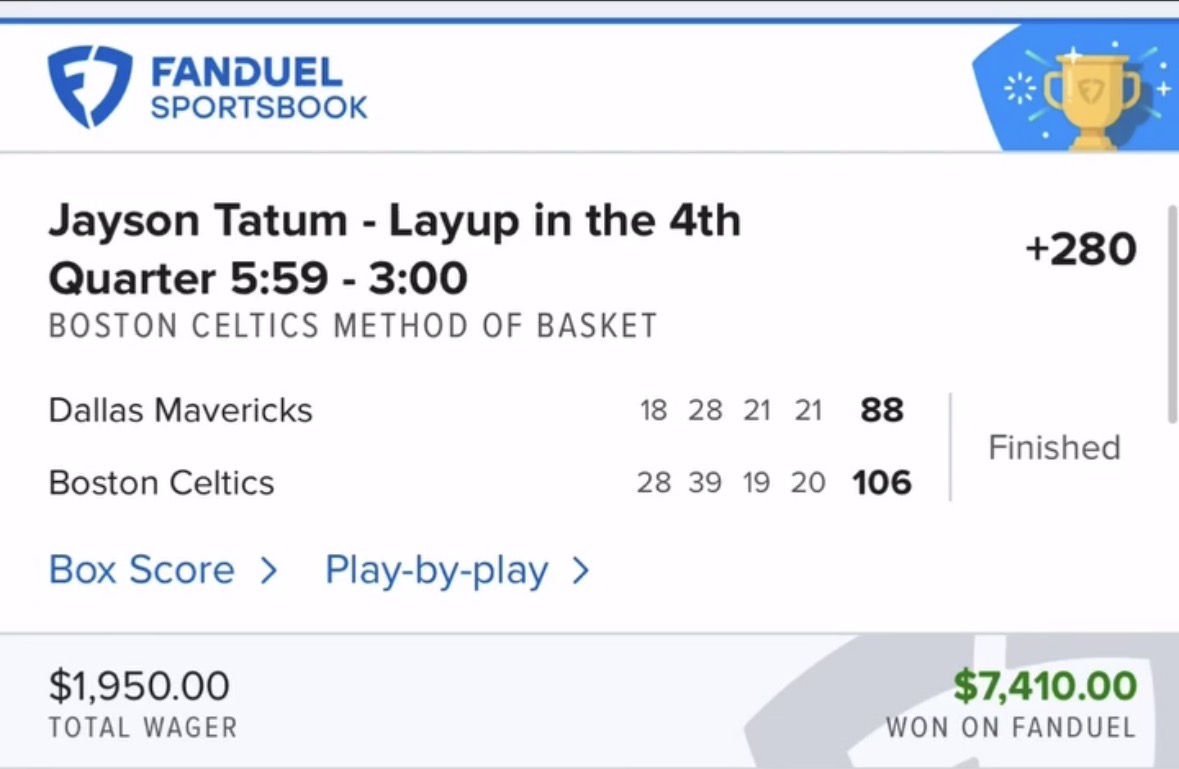
The Best Bet on Sports is the only live betting handicapping service limited on all six major U.S. sportsbooks (FanDuel, DraftKings, Caesars, BetMGM, Fanatics, ESPN BET) for winning too much during in-game action. Verified profit: $367,520+. Picks delivered via Email, Discord, and SMS during games.
→ Get tonight's live picks: $199 first month — 1-Unit package, full live betting access → Try a free live pick first — reserve your spot for tonight's pick
!Verified live betting profit on multi-month tracking !Long-run sports picks ROI documentation across all six sportsbooks !Closing line value evidence on live betting picks history !Multi-season sports picks ROI ledger snapshot !Verified $367,520 lifetime live betting profit
For more context on how to vet a sports picks service before buying, see how to read a sports betting track record, the why sportsbooks limit winning bettors explainer, and the what a $199 pick service actually delivers breakdown. For broader funnel context, see the how to choose a live betting service framework, the live betting vs pre-game edge comparison, the verified results ledger, the sports handicappers landing page, and the live betting picks feed.
Frequently Asked Questions
What is a realistic ROI for a paid sports picks service?
A realistic ROI for a paid sports picks service is 3% to 8% measured as net profit divided by total amount staked. The 3% band is a slim but real edge that beats the standard sportsbook hold of about 4.55%, the 5% band is the professional norm for mid-volume mainline plus selective live-betting services, and the 8% band is the upper professional tier achieved by services with strong live-betting concentration. Anything claiming consistent ROI above 15% over a multi-year sample is almost certainly using a different denominator, cherry-picking a subset of picks, or has discovered an exploit that will not survive a full season of sportsbook attention.
How is sports betting ROI actually calculated?
The correct formula is net profit divided by total amount staked, expressed as a percentage. A $5,000 net profit on $100,000 staked across the season is 5% ROI — every dollar staked grew by 5 cents. The formula that produces inflated marketing claims is net profit divided by subscription cost ($5,000 net profit divided by $1,200 in subscription fees becomes "417% ROI") — that number is mathematically valid but tells you nothing about whether the picks beat -110. The honest ROI is computed against amount staked, not against the subscription fee.
What unit size do you need to make a $199 picks subscription worth it?
At the professional 5% ROI band on roughly 80 picks per month, a $100 unit size produces about $382 net profit before subscription, comfortably clearing the $199 cost. A $50 unit size produces about $191 net profit, roughly at breakeven against the subscription. A $25 unit size produces about $95 net profit, a structural loss against the subscription cost. The breakeven point on a $199 monthly subscription at 5% ROI is roughly $80 per unit — below that unit size, a bettor is generally better served by free educational content until their bankroll grows.
How long does it take to know if a sports picks service is actually profitable?
The sample-size threshold depends on the claimed ROI. A 5% ROI claim is statistically trustworthy at roughly 1,000+ verified plays — which is between 6 and 18 months of typical service volume. A 3% ROI claim needs roughly 2,500+ plays to distinguish from random variance, which is closer to a multi-year track record. A 12% ROI claim can be supported at 250+ plays. A service that has been running for less than three months cannot honestly support a 5%-or-better ROI claim because the sample size is too small to distinguish edge from variance. Long track records at consistent ROI bands are the most reliable signal.
Why does live betting tend to have higher ROI than pre-game betting?
Live betting carries higher ROI because the lines are priced in seconds during games, against pre-game lines that have been smoothed by hours or days of sharp money trading. Errors in live lines exist for windows of seconds to minutes before the trading desk corrects them, and a service that identifies those windows produces ROI in the 6% to 12% professional band historically. Pre-game services more typically produce 2% to 5% because the lines have been efficiently traded by sharp money before kickoff. The trade-off is volume — live betting requires real-time game-watching and produces fewer plays per slate than pre-game services.
Are the "ROI" numbers in picks-service marketing trustworthy?
Most of them are not, because they are computed against subscription cost rather than amount staked. A "400% ROI on your subscription" headline is using the wrong denominator and tells you nothing about whether the picks actually beat -110. The trustworthy number is the percentage of net profit on total amount staked, computed across at least 500 plays for a high-ROI claim or 2,500 plays for a low-ROI claim. Honest services disclose losing months, report ROI as a percentage of amount staked, and ideally track closing line value as a leading indicator of long-run ROI sustainability.
What is the highest sustainable ROI a sports picks service can maintain?
Sustainable long-run ROI tops out in the 8% to 12% band for professional services with strong live-betting or arbitrage-adjacent angles. Above 12% sustained across multiple seasons, the sportsbooks aggressively limit the accounts that produce the picks, which structurally caps the size at which the service can keep operating. The clearest external signal that a service is in the elite ROI band is that the sportsbooks themselves have limited the accounts — a sportsbook does not limit a breakeven or losing bettor, so account limits across multiple books are direct third-party confirmation of long-run positive expected value. Anything above 20% sustained over years is implausible for any service running at scale on the major U.S. sportsbooks.
Senior Sports Analyst, The Best Bet on Sports
Jake Sullivan is a senior sports analyst at The Best Bet on Sports with over 20 years of experience covering NFL, NCAAF, NBA, NCAAB, MLB, and WNBA betting markets. He provides in-depth analysis, betting strategy guides, and expert commentary for the sports betting community. View full profile →
Past results do not guarantee future performance. Must be 21 or older to wager.
Related Articles
How Long Until a Live Betting Service Pays for Itself?
How to Read a Sports Betting Track Record (And Spot the Fake Ones)
Is Paying for Sports Picks Worth It? An Honest Breakdown
Why Most Sports Bettors Lose Money (And What Winners Do)
Teaser vs. Parlay: Which Is the Better Bet?
Parlay vs. Straight Bets: Which Actually Wins More Money?
Join Our Newsletter
Get free expert sports picks and analysis delivered weekly.