MLB Pitcher Matchup Analysis - How to Bet Baseball Using Starting Pitching

MLB pitcher matchup analysis is the foundation of profitable baseball betting because the starting pitcher has more individual impact on game outcome than any single player in any other major team sport. Analyzing pitcher matchups for betting purposes requires going beyond ERA to evaluate FIP, xFIP, SIERA, batted ball data, platoon splits, and how a pitcher's stuff profile matches up against the opposing lineup's specific weaknesses — the analytical depth that separates winning baseball handicappers from those who bet on name recognition alone.
# MLB Pitcher Matchup Analysis: How to Bet Baseball Using Starting Pitching
MLB pitcher matchup analysis is the foundation of professional baseball betting because the starting pitcher directly controls roughly 60 to 70% of a team's run-prevention outcome on any given day, making pitcher evaluation using advanced metrics like FIP, xFIP, strikeout rate, walk rate, and handedness splits the single most important skill for anyone serious about finding profitable MLB picks and exploiting mispriced lines in the baseball betting market.
I have been breaking down pitcher matchups for over two decades at The Best Bet on Sports, and baseball remains the sport where analytical edge translates most directly into betting profit. Unlike football or basketball, where complex team-level interactions make individual player impact harder to isolate, baseball is fundamentally a one-on-one sport. Pitcher versus batter, repeated 27-plus times per game. When you correctly evaluate pitcher quality relative to opponent offensive strength using the right metrics, you gain an informational edge over the betting public that relies on name recognition, ERA, and recent win-loss records, all of which are imprecise measures that frequently mask true performance levels.
Why Do Pitcher Matchups Drive MLB Betting Value?
The starting pitcher's influence on the outcome of a baseball game is larger than any single player's impact in any other major sport. A dominant starter can suppress an elite offense by three to four runs below their season average. A struggling starter can give up six runs to a below-average lineup. This individual impact creates massive game-to-game variance that sportsbooks must price, and the more variance in a market, the more opportunities exist for sharp bettors.
The public typically prices pitchers based on three factors: name recognition, ERA, and recent win-loss records. All three are problematic for betting purposes. Name recognition reflects past performance, not current ability. ERA includes defensive influence and batted-ball luck. Win-loss record depends heavily on run support, which the pitcher does not control.
Sharp bettors use a completely different set of metrics to evaluate pitchers, and the gap between public perception and analytical reality is where MLB betting value lives every single day of the season.
What Pitching Statistics Actually Predict MLB Performance?
Understanding which statistics predict future pitching performance and which ones merely describe past outcomes is the core skill of MLB handicapping.
ERA versus FIP represents the most critical distinction in pitcher evaluation. ERA, or Earned Run Average, is the stat most casual bettors use. It is problematic because it includes defensive performance and is heavily influenced by balls in play, which have a large luck component that regresses toward the mean over time.
FIP, or Fielding Independent Pitching, removes defense and ball-in-play luck by measuring only what the pitcher directly controls: strikeouts, walks, hit-by-pitches, and home runs. FIP correlates much more strongly with future ERA than current ERA does, making it a superior predictive tool for betting purposes.
When a pitcher has a 4.80 ERA but a 3.65 FIP, he is likely pitching better than his ERA suggests. The gap is usually due to poor defense behind him or bad luck on batted balls, both of which tend to normalize over time. This is a potential buy-low spot where the market is undervaluing the pitcher based on his inflated ERA.
xFIP normalizes home run rate to league average on fly balls, removing park effects and home run luck from FIP. This is the deepest layer of ERA-estimator analysis and produces the most stable forward-looking projections. Bettors who combine FIP and xFIP analysis find undervalued and overvalued pitchers far more reliably than those using ERA alone.
| Metric | What It Measures | Predictive Value | Public Awareness |
|---|---|---|---|
| ERA | Past runs allowed (with defense) | Low | Very High |
| FIP | Pitcher-controlled outcomes | High | Moderate |
| xFIP | FIP with normalized HR rate | Very High | Low |
| K% | Strikeout rate | Very High | Moderate |
| BB% | Walk rate | High | Moderate |
| BABIP | Batting avg on balls in play | Low (luck-driven) | Low |
| Hard Hit% | Quality of contact allowed | High | Low |
Strikeout and walk rates are the most stable, pitcher-controlled metrics on a game-to-game basis. High-strikeout, low-walk pitchers are the gold standard for betting purposes because they produce consistent results with low variance. Pitchers with low strikeout rates who rely on contact management are volatile, and their actual game results fluctuate significantly around their true talent level, making them harder to project accurately for betting purposes.
How Do You Use Handedness Splits in MLB Pitcher Analysis?
Starting pitchers perform very differently against left-handed and right-handed batters, and this platoon effect is one of the most exploitable edges in baseball betting when the opposing lineup skews heavily in one direction.
A right-handed starter with a devastating slider may post a .220 opponents' batting average against righties but struggle significantly against lefties who can lay off that breaking ball more easily. When the opposing lineup is heavily left-handed, handedness splits reveal opportunities that straight ERA or FIP analysis misses entirely.
Key split stats to track include wOBA versus left-handed and right-handed batters, which captures the full value of all plate appearance outcomes weighted by their run value. Strikeout rate split by batter hand reveals whether a pitcher can miss bats against both sides or only one. Hard contact rate split by batter hand shows whether the quality of contact changes meaningfully based on the platoon matchup.
The practical application is straightforward. When a starting pitcher with significant platoon splits faces a lineup loaded with batters from his weaker side, the market often underestimates the scoring potential because the aggregate stats mask the matchup-specific vulnerability.
How Does Bullpen Strength Affect MLB Betting Lines?
Starting pitcher analysis gets the most attention in baseball handicapping, but bullpen quality can be equally important for specific bet types that I recommend regularly.
First 5 innings bets, commonly called F5 bets, isolate starting pitcher performance entirely. They remove bullpen variance from your bet, making them ideal when you have strong conviction on a starter matchup but uncertainty about late-game bullpen deployment. I use F5 bets extensively because they allow me to bet my strongest analytical area, starter evaluation, without exposing the play to bullpen randomness.
Total bets are significantly affected by bullpen quality. A strong bullpen suppresses opponent scoring in the sixth through ninth innings, pushing totals under. A weak bullpen does the opposite. When both teams have strong starters but weak bullpens, the total becomes harder to predict because the starter analysis tells one story and the bullpen data tells another.
Live betting creates critical decision points when a starter exits early. If you bet a total based on starter quality and the starter gets pulled in the fourth inning, the opposing bullpen's strength determines whether your bet still has value. Understanding bullpen quality before the game helps you make informed live decisions.
How Do Park Factors Influence Pitcher Matchup Analysis?
Park factors are one of the most overlooked elements in casual MLB betting analysis. The same pitcher in Coors Field versus Oracle Park faces fundamentally different run environments, and failing to adjust for this produces consistently inaccurate projections.
Coors Field in Denver inflates run scoring by roughly 20 to 30% compared to a neutral environment. A pitcher with a 3.50 FIP pitching in Coors might be expected to produce a game outcome more consistent with a 4.20 ERA. The thin air reduces pitch movement, increases fly ball carry, and generally favors offense in ways that every metric needs to be adjusted for.
Conversely, pitcher-friendly parks like Oracle Park in San Francisco and Petco Park in San Diego suppress run scoring. Pitchers who appear league-average by their road numbers may produce significantly better results in these environments.
Our MLB picks page accounts for park factors in every single analysis. We adjust our pitcher projections for venue before comparing to market lines, because failing to do so introduces systematic errors that cost money over a 162-game season.
What Role Does Lineup Construction Play in Pitcher Analysis?
Evaluating a pitcher matchup without considering the opposing lineup is like evaluating a spread without considering the opponent. The context of who the pitcher faces matters as much as the pitcher's own quality.
Key lineup factors include the team's overall wOBA and OPS, which measure aggregate offensive production. But more important is the specific lineup posted for that game, which can differ significantly from the season-long roster average. Platoon advantages when the lineup is stacked with batters who have the platoon advantage against the opposing starter create exploitable situations.
Recent lineup trends also matter. A team that has been swinging the bats well over the past ten games, measured by hard contact rate and barrel rate rather than just batting average, is more likely to continue producing quality at-bats regardless of short-term results.
At The Best Bet on Sports, we check confirmed lineups before releasing every MLB play and adjust our projections based on the actual names in the order rather than relying on season-long team averages that may not reflect the day's specific matchup.
Where Can I Find Expert MLB Picks Using This Analysis?
Our MLB picks analysis runs throughout the full baseball season, from Opening Day through the World Series. Every play on the MLB picks page includes a full written breakdown covering the starting pitcher matchup using FIP and xFIP analysis, lineup construction and platoon dynamics, park factors, bullpen assessment, and line value evaluation.
The Best Bet on Sports has documented MLB results going back over 20 seasons. Visit our results page to evaluate our long-term track record before subscribing. We believe that the depth of our pitcher analysis and the transparency of our documentation set us apart from any competing MLB handicapping service.
For bettors looking to complement their MLB betting with other sports, our NFL picks and NBA picks pages provide the same level of analytical depth during those respective seasons. Our football picks page features comprehensive analysis during the fall when MLB and NFL seasons overlap.
If this is your entry point, pair it with our guide to MLB NRFI/YRFI first-inning betting strategy.
---
Related Strategy Reading
For deeper context on the angles covered above, our analysis of mlb early season regression betting strategy and mlb handicapping tips for winning pairs well with this guide; our baseball picks reflect these same principles applied to live games.
Frequently Asked Questions
What is the best statistic for evaluating MLB starting pitchers for betting?
FIP is more predictive than ERA for future performance because it removes the influence of defense and ball-in-play luck. xFIP takes it further by normalizing home run rates to league average on fly balls. Combining FIP, xFIP, strikeout rate, and walk rate gives you the most reliable picture of a pitcher's true performance level for betting evaluation.
How do I analyze a pitcher matchup for MLB betting?
Start with the two starting pitchers' FIP and xFIP versus the opposing lineup's wOBA and strikeout rate. Check handedness splits if the lineup skews heavily one way. Factor in bullpen strength, park factors, and recent pitcher form measured by hard contact allowed. Finally, compare your projected total or run-line expectation to the actual market line. When there is a significant gap, that is where the betting value lives.
Are first 5 innings MLB bets a good strategy?
Yes. F5 bets are an excellent tool when you have high conviction on a starting pitcher matchup but limited information about bullpen deployment or concern about bullpen quality. They isolate exactly the variable you have analyzed most carefully. The Best Bet on Sports regularly releases F5 recommendations when the starter analysis is strong but late-game factors introduce unnecessary risk.
How important are park factors in MLB betting?
Park factors are essential. The difference between the highest and lowest run-scoring environments in baseball is roughly 40%, which means ignoring park factors introduces massive systematic errors in your projections. Every serious MLB bettor adjusts their pitcher projections for the specific ballpark before comparing to market lines.
Should I bet MLB moneylines or run lines?
Moneylines are the standard bet type for baseball and are appropriate for most MLB plays. Run lines at plus or minus 1.5 offer different risk-reward profiles and are best used when your analysis suggests a blowout is likely or unlikely. Strong pitching matchups with clear favorites often provide better value on the run line than the moneyline.
How do I identify a pitcher who is due for regression?
Compare a pitcher's ERA to their FIP and xFIP. A large gap in either direction indicates likely regression toward the FIP level. Also check BABIP, which is batting average on balls in play. A BABIP significantly above .300 suggests bad luck that will likely normalize, while a BABIP significantly below .300 suggests good luck that will likely regress. These regression signals create buying and selling opportunities in the betting market.
How does weather affect MLB pitcher matchup analysis?
Wind direction and temperature significantly affect home run probability and total scoring. Wind blowing out to center field increases scoring by roughly ten to fifteen percent. Cold temperatures below 55 degrees suppress bat speed and reduce home run probability. Humidity has a minimal but measurable effect on ball carry. Check weather conditions as part of your pre-game analysis, especially for totals bets at outdoor venues.
The Best Bet on Sports · 1.5M followers on TikTok
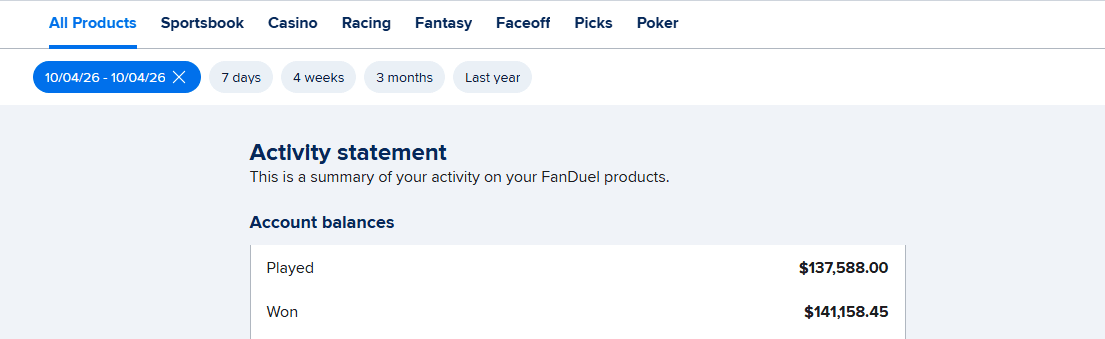
Sports Betting TikTok is the live betting account behind The Best Bet on Sports, covering NFL, NCAAF, NBA, NCAAB, MLB and WNBA markets in real time. The account has been limited on all six major U.S. sportsbooks — FanDuel, DraftKings, Caesars, BetMGM, Fanatics and ESPN BET — for winning on live betting, with $367,520 in verified profit since 2005. View full profile →
Past results do not guarantee future performance. Must be 21 or older to wager.
Related Articles
MLB Starting Pitcher Betting: How to Handicap Pitching Matchups in April 2026
MLB Betting Picks and Early Season Analysis 2026
MLB Moneyline Betting Guide 2026 - Best Bets for the Early Season
MLB Early Season Betting Trends: What the April 2026 Data Says
MLB Home Plate Umpire Betting: How Umpires Move Totals and Strikeout Props
MLB Run Line Betting Strategy: When to Take -1.5 vs Moneyline April 2026
Get real live betting picks
From $39.95/mo · Cancel anytime · Email + Discord delivery
● Get The Picks
Choose your package
Tap any tier below to select · Subscribe in one tap
👇 Tap any package to select it
✓ You're selecting
25 Units · $99.95/month
25 unit picks per month. Sweet spot for most bettors — plenty of action without going all-in.
- ✓25 live betting selections/month
- ✓Email + Discord delivery
- ✓All sports (NFL, NCAAF, NBA, NCAAB, MLB)
- ✓Mix of 1, 2, 3, 5-unit rated plays
- ✓Cancel anytime
Secure PayPal · Cancel anytime · No hidden fees · 21+ · +$367K verified
+$367,520 verified · Limited on 6 sportsbooks · 20 years documented · See Proof
Join Our Newsletter
Get free expert sports picks and analysis delivered weekly.