NFL Point Differential vs. Record: Does It Beat the Spread?

NFL teams with a better point differential than their record don't beat the spread. From 1999 through 2025, after Week 4, teams at least 1.5 wins below their Pythagorean expectation went 319-322-19 against the spread, or 49.77 percent. Lucky teams 1.5 wins above it covered 49.62 percent. Point differential predicts who wins, but the spread already prices it.
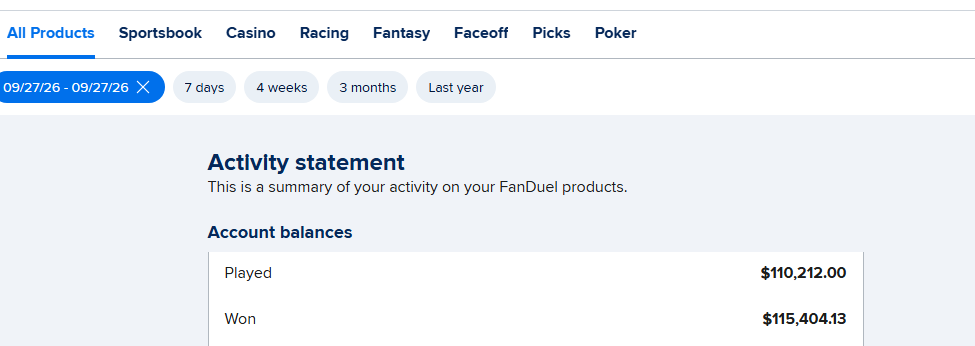
NFL teams with a better point differential than their record don't beat the spread. We checked every regular-season game from 1999 through 2025, from Week 5 on, and measured each team's "luck" as actual wins minus the wins its points scored and allowed predict. Teams at least 1.5 wins below that expectation went 319-322-19 against the spread, a 49.77 percent cover rate. Teams at least 1.5 wins above it covered 49.62 percent. The unlucky teams did win more than their records suggested, 42.5 percent of the time against a 27.4 percent winning percentage, but the spread already knew. The Best Bet on Sports has built a verified $367,520+ in profit across all sportsbooks over more than twenty years, and point differential is one of the first numbers the market prices in.
Point differential is the most popular "smart" stat in football betting. A team that's 3-5 but has outscored its opponents is supposed to be due. A team that's 5-4 and has been outscored is supposed to be a fraud. Both ideas are mostly right about who will win. The question for bettors is whether they're right against the number. So we tested it.
How Did We Measure Luck?
We used the nflverse game file for every regular-season game from 1999 through 2025, plus 2026 through Sunday of Week 9. Before each game, we rebuilt each team's record and its points scored and allowed, using only games already played.
From those points, we calculated expected wins with the standard Pythagorean formula for football, using an exponent of 2.37. A team's luck is its actual wins minus its expected wins. A team at -1.5 has won a game and a half fewer than its scoring says it should. A team at +1.5 has won a game and a half more.
We started in Week 5, required at least four games played, and graded every game against the closing spread. That gave us 10,490 team-games. As a check, all of them together went exactly 50.00 percent against the spread, which is what you'd expect when every game counts once for each side.
Do Unlucky Teams Cover the Spread?
No more often than anyone else.
| Wins vs. expected wins | Team-games | ATS record | Cover rate | Won outright |
|---|---|---|---|---|
| 1.5 or more below | 660 | 319-322-19 | 49.77% | 42.50% |
| 1.0 to 1.5 below | 1,003 | 517-467-19 | 52.54% | 47.51% |
| 0.5 to 1.0 below | 1,559 | 757-766-36 | 49.70% | 46.79% |
| Within 0.5 | 4,011 | 1,954-1,940-117 | 50.18% | 49.78% |
| 0.5 to 1.0 above | 1,544 | 729-772-43 | 48.57% | 51.33% |
| 1.0 to 1.5 above | 908 | 439-441-28 | 49.89% | 55.62% |
| 1.5 or more above | 805 | 390-396-19 | 49.62% | 56.96% |
Look at the two columns separately. The outright column moves exactly the way the point-differential crowd says it should. The unluckiest teams won 42.5 percent of their next games and the luckiest won 56.96 percent. Their records going in told a different story: the unlucky group had a combined .274 winning percentage, and the lucky group .740.
The ATS column barely moves. Every band lands between 48.57 and 52.54 percent, and the one band above the 52.38 percent break-even point at -110 sits in the middle of the table, not at the extreme. The correlation between a team's luck and whether it covered was -0.012, which is effectively zero.
Does Point Differential Predict Better Than Record?
It does, but by less than you'd think, and that's the whole problem for bettors.
We measured how well each stat lines up with the final margin of the next game. Winning percentage had a correlation of 0.235. Point differential per game and Pythagorean win percentage both came in at 0.26. Point differential is the better predictor. It's just not a secret. When an unlucky 2-5 team lines up against a lucky 5-2 team, the spread doesn't treat them as a 2-5 team and a 5-2 team. It treats them much closer to what their scoring says.
The unlucky teams won 42.5 percent of the time, a bit below their 45.4 percent Pythagorean win rate. The lucky teams won 56.96 percent, a bit above their 55.39 percent. In other words, both groups landed between their record and their point differential, closer to the point differential. That's about where the market prices them.
Are There Any Spots Where It Works?
A couple of splits look interesting. None of them is strong enough to bet blindly.
| Situation | ATS record | Cover rate |
|---|---|---|
| Unlucky team (1.5+ below) as an underdog | 214-191-11 | 52.84% |
| Unlucky team as an underdog of 3 or more | 182-160-10 | 53.22% |
| Unlucky team as a favorite | 103-130-8 | 44.21% |
| Unlucky team as a home favorite | 72-95-5 | 43.11% |
| Losing record, positive point differential | 277-252-16 | 52.36% |
| Same, as an underdog | 135-115-9 | 54.00% |
| Winning record, negative point differential | 236-262-20 | 47.39% |
The pattern that shows up is about the unlucky team's price, not its luck. As an underdog, the unlucky team covered 52.84 percent, barely above break-even. As a favorite, it covered just 44.21 percent. When the market has already made an unlucky team the favorite, it has priced in the bounce-back and then some.
The best-looking number is a losing team with a positive point differential getting points: 54.00 percent on 250 graded games. That's about 1.3 standard deviations above 50 percent. It's worth knowing, but it's the kind of split you find when you slice a dataset enough ways.
Has the Market Caught Up?
The era splits say yes.
| Seasons | Unlucky teams ATS | Lucky teams ATS | Winning record, negative PD |
|---|---|---|---|
| 1999-2007 | 94-93-8 (50.27%) | 107-104-5 (50.71%) | 69-74-6 (48.25%) |
| 2008-2016 | 114-96-6 (54.29%) | 130-121-4 (51.79%) | 65-86-7 (43.05%) |
| 2017-2025 | 111-133-5 (45.49%) | 154-171-10 (47.38%) | 102-102-7 (50.00%) |
From 2008 through 2016, betting unlucky teams covered 54.29 percent and fading winning teams with negative point differentials covered nearly 57 percent. Point differential was a real edge then. By the last nine seasons, it had flipped. Unlucky teams covered just 45.49 percent, and the winning-record, negative-differential teams were exactly 50 percent.
That's what happens when an edge goes public. Pythagorean wins are now on every stats site and in every preview, and the market prices them in, sometimes too far. The unlucky teams covered more than half the time in only 11 of the 27 seasons.
By time of year, the results didn't sharpen late either. Unlucky teams covered 51.92 percent in Weeks 5-8, 50.22 percent in Weeks 9-13 and 49.17 percent in Weeks 14-18. Lucky teams covered 47.27 percent late in the season, the lowest number in that split, but again within normal variance.
Which Teams Are Lucky and Unlucky in 2026?
Here are the biggest gaps going into Week 10, using games through Sunday of Week 9. Buffalo and Minnesota play tonight, so their numbers will change.
| Team | Record | Points for-against | Expected wins | Wins vs. expected | Week 10 spread |
|---|---|---|---|---|---|
| Chargers | 0-8 | 121-219 | 1.57 | -1.57 | +4.5 at Ravens |
| Titans | 1-7 | 144-199 | 2.54 | -1.54 | +9.5 vs. Jaguars |
| Jets | 2-7 | 182-223 | 3.44 | -1.44 | +7.5 vs. Bills |
| Texans | 3-5 | 209-192 | 4.40 | -1.40 | -4.5 at Browns |
| Bills | 6-1 | 233-181 | 4.52 | +1.48 | -7.5 at Jets |
| Browns | 5-4 | 161-196 | 3.47 | +1.53 | +4.5 vs. Texans |
Week 10 spreads are from the nflverse closing-line feed this morning and will move.
The matchup that stands out is Houston at Cleveland. The Texans are 3-5 with a positive point differential, the unluckiest team in the league with a winning scoring margin. The Browns are 5-4 despite being outscored by 35 points, the luckiest team in the NFL. The market has already sorted that out. Houston is a 4.5-point road favorite.
That's exactly the spot where the history says to be careful. Unlucky teams as road favorites went 31-35-3 against the spread. Lucky teams as underdogs went 146-153-10, or 48.83 percent. Neither side has a number worth betting on luck alone.
So far this season, teams at least one win below expectation are 8-10 against the spread in Weeks 5 through 9, and teams at least one win above are 11-8. That's a small sample, and it's going the opposite way from the theory.
Why Does This Matter When You Pay for Picks?
Because "this team is better than its record" is one of the most common reasons a pick gets sold. It sounds sharp. Over the last nine seasons, it lost money.
That's the same lesson we found when we tested NFL favorites with worse records and bad NFL teams against the spread. Any stat you can find on a public stats site, the market has already used. If you're paying for NFL picks against the spread, you should be paying for something the standings and the box scores don't already show. It also lines up with our test of NFL teams that won while outgained. For how the contenders stack up in the futures market, see our Super Bowl contenders ranked by odds.
That's why our football handicappers focus on the live game rather than the season-long numbers. If you're comparing services, our guide to expert sports picks explains how we approach each slate, and our pay for sports picks page covers what you should expect for your money. The weekly card is on our NFL picks page. Basketball has its own version of this trap early in the season, and our basketball handicappers page explains how we handle it.
What This Study Doesn't Cover
This study uses closing spreads and regular-season games from Week 5 on, with each team's record and points rebuilt from games already played. It uses one version of the Pythagorean formula, with an exponent of 2.37, and doesn't adjust for strength of schedule, injuries or quarterback changes, which can explain a gap between record and scoring. Ties count as half a win. The 2026 sample runs through Sunday of Week 9, and the Week 10 spreads are from the morning closing-line feed. Lines move, so check the number before kickoff.
Get Tonight's Live Picks
Want live in-game NFL calls, including the late one-score spots where a team's luck shows up, sent to your phone during the game?
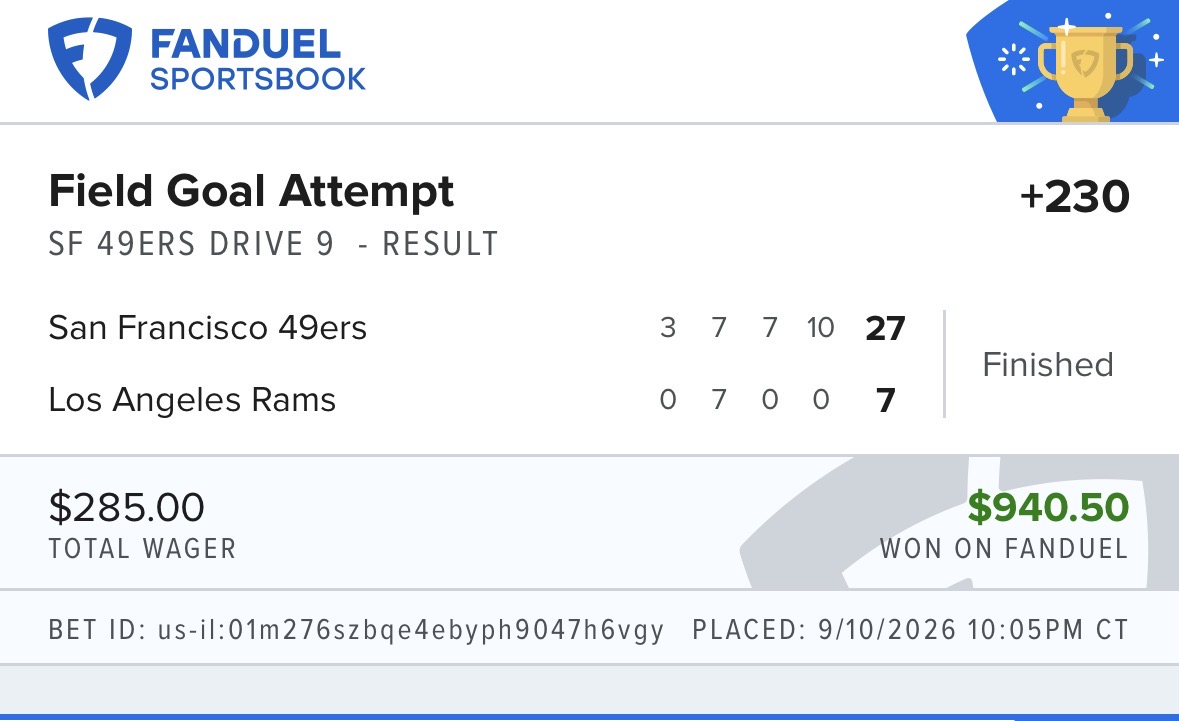
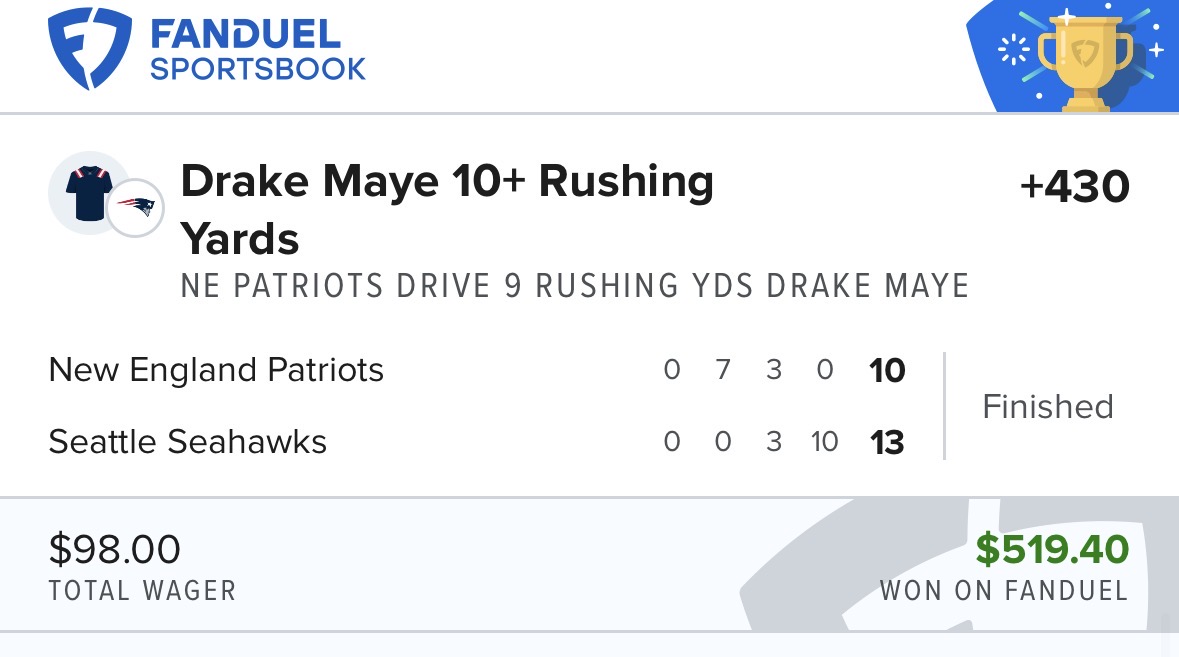
The Best Bet on Sports is the only live betting handicapping service limited on all six major U.S. sportsbooks (FanDuel, DraftKings, Caesars, BetMGM, Fanatics, ESPN BET) for winning too much during in-game action. Verified profit: $367,520+. Live calls go out through Email and Discord during games, and every bet in the $10,000 to $100,000 challenge is posted as it happens.
→ Join The Best Bet on Sports community — newsletter, live stream and Discord → Try a free live pick first — reserve your spot for tonight's pick
Frequently Asked Questions
Do NFL teams with a better point differential than record cover the spread?
Not reliably. From 1999 through 2025, in Weeks 5 and later, teams at least 1.5 wins below their Pythagorean expected wins went 319-322-19 against the spread, a 49.77 percent cover rate. That's below the 52.38 percent needed to break even at -110.
What are Pythagorean wins in the NFL?
Pythagorean wins estimate how many games a team should have won from its points scored and allowed. The football version raises points to the 2.37 power. A team winning well below that estimate has usually lost close games, and a team winning well above it has usually won them.
Do unlucky NFL teams win more often than their record suggests?
Yes. Teams at least 1.5 wins below expectation had a combined .274 winning percentage but won 42.5 percent of their next games. Their Pythagorean win rate was 45.4 percent, so they landed closer to their point differential than to their record.
Should you fade lucky NFL teams?
Not on luck alone. Teams at least 1.5 wins above expectation covered 49.62 percent from 1999 through 2025. As underdogs, they covered 48.83 percent. The spread already prices most of the regression.
Did point differential ever work as a betting angle?
It did from 2008 through 2016, when unlucky teams covered 54.29 percent and winning teams with negative point differentials covered just 43.05 percent. From 2017 through 2025, unlucky teams covered only 45.49 percent, which suggests the market caught up.
Is there any point differential spot worth watching?
Losing teams with a positive point differential covered 54.00 percent as underdogs, on 250 graded games. That's about 1.3 standard deviations above 50 percent, so it's worth watching but not betting blindly.
Which NFL teams are the luckiest and unluckiest in 2026?
Going into Week 10, the Browns are the luckiest team, 5-4 despite being outscored by 35 points. The Chargers, Titans, Jets and Texans are the unluckiest. The Texans are 3-5 with a positive point differential and are 4.5-point road favorites at Cleveland.
The Best Bet on Sports · 1.5M followers on TikTok
Sports Betting TikTok is the live betting account behind The Best Bet on Sports, covering NFL, NCAAF, NBA, NCAAB, MLB and WNBA markets in real time. The account has been limited on all six major U.S. sportsbooks — FanDuel, DraftKings, Caesars, BetMGM, Fanatics and ESPN BET — for winning on live betting, with $367,520 in verified profit since 2005. View full profile →
Past results do not guarantee future performance. Must be 21 or older to wager.
Related Articles
NFL Favorites With Worse Records: Should You Fade Them?
NFL Teams That Won While Outgained, Tested
Live Betting Strategy for NFL Games: How Sharps Attack In-Game Lines
NFL Over/Under Betting Guide - How to Beat NFL Totals in 2026
NFL Teams After an Upset Loss, Tested
2026 NFL Draft Betting Odds: Who Goes No. 1 and the Best Prop Bets
Get real live betting picks
From $39.95/mo · Cancel anytime · Email + Discord delivery
● Get The Picks
Choose your package
Tap any tier below to select · Subscribe in one tap
👇 Tap any package to select it
✓ You're selecting
25 Units · $99.95/month
25 unit picks per month. Sweet spot for most bettors — plenty of action without going all-in.
- ✓25 live betting selections/month
- ✓Email + Discord delivery
- ✓All sports (NFL, NCAAF, NBA, NCAAB, MLB)
- ✓Mix of 1, 2, 3, 5-unit rated plays
- ✓Cancel anytime
Secure PayPal · Cancel anytime · No hidden fees · 21+ · +$367K verified
+$367,520 verified · Limited on 6 sportsbooks · 20 years documented · See Proof
Join Our Newsletter
Get free expert sports picks and analysis delivered weekly.