NFL Winning Streaks Against the Spread: Do Hot Teams Cover?

NFL teams on winning streaks don't beat the spread. From 1999 through 2025, teams on four-game win streaks went 490-506-29 against the spread, 49.20 percent. Teams on seven-game losing streaks covered 55.32 percent. When a team on a three-game win streak played one on a three-game skid, the hot team covered only 43.08 percent.
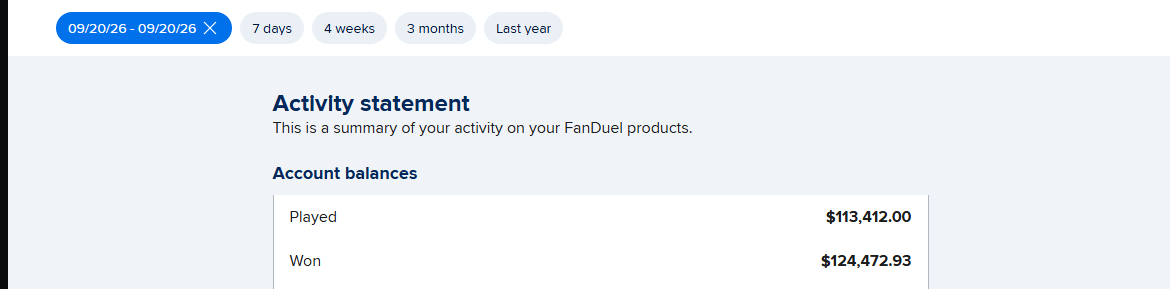
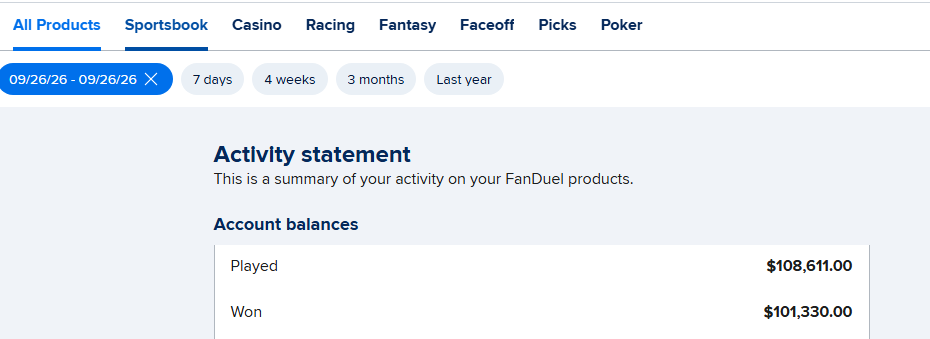
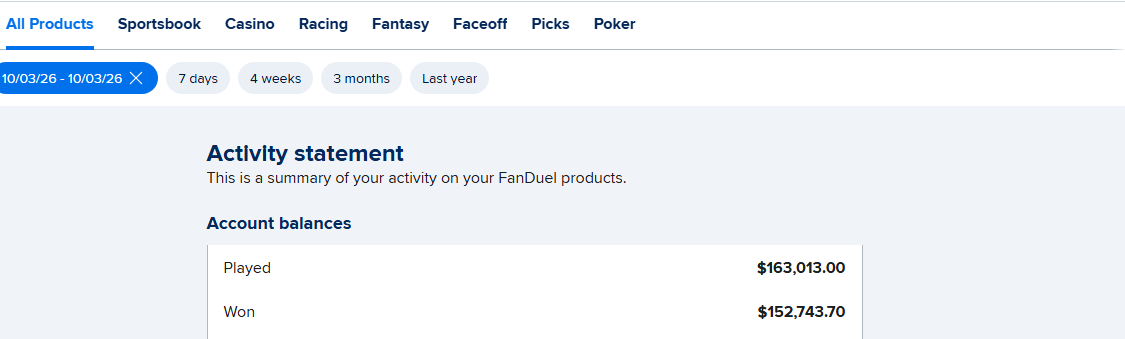
NFL teams on winning streaks don't beat the spread. We checked every regular-season game from 1999 through 2025. Teams riding a four-game win streak went 490-506-29 against the spread, a 49.20 percent cover rate, even though they won 63.61 percent of those games straight up. Teams on seven-game losing streaks covered 55.32 percent. The sharpest split came when the two met: a team on a three-game win streak facing a team on a three-game losing streak covered only 43.08 percent of the time (109-144-5). The Best Bet on Sports has built a verified $367,520+ in profit across all sportsbooks over more than twenty years, and streaks are one of the stories the betting public pays the most for.
"Ride the hot team" is one of the oldest rules in betting. It's half right. Hot teams keep winning. They just don't keep covering, because the spread grows with the streak. This study shows how much it grows and where the market overshoots.
How Did We Measure Streaks?
We used the nflverse games file, which has final scores and closing spreads for every game. For each team, we counted its straight-up winning or losing streak entering each game, within the same season. A tie resets the streak to zero. Week 1 starts every team at zero, so a streak from last December doesn't carry over.
A cover means the team beat the closing spread. Pushes are listed but left out of the percentage. The full sample is 13,934 team-games, and every team's cover rate across all of them is exactly 50.00 percent, as it has to be.
Do Teams on Winning Streaks Cover the Spread?
No. They win more often, but the spread takes that away.
| Win streak entering game | Team-games | ATS record | Cover rate | Won straight up | Avg spread |
|---|---|---|---|---|---|
| 2+ | 3,328 | 1612-1639-77 | 49.58% | 58.14% | -2.6 |
| 3+ | 1,803 | 879-881-43 | 49.94% | 61.84% | -3.5 |
| 4+ | 1,025 | 490-506-29 | 49.20% | 63.61% | -4.3 |
| 5+ | 605 | 290-298-17 | 49.32% | 66.78% | -4.9 |
| 6+ | 372 | 172-192-8 | 47.25% | 69.09% | -5.3 |
| 7+ | 235 | 109-120-6 | 47.60% | 71.49% | -5.9 |
The pattern is clear. Every extra win makes the team more likely to win the next game: from 58 percent after two straight to 71 percent after seven. And every extra win moves the spread about half a point to a point. The two cancel. Teams on four-game streaks won by an average of 4.38 points against an average spread of 4.25. The market priced them almost exactly.
The cover rate does dip at six and seven straight wins, to about 47 percent. But those samples are small (372 and 235 games). A 47 percent rate on 235 games is within normal variance of 50 percent. It's a lean, not a rule.
Do Teams on Losing Streaks Cover?
They do a little better than average, and the effect grows with the length of the streak.
| Losing streak entering game | Team-games | ATS record | Cover rate | Won straight up | Avg spread |
|---|---|---|---|---|---|
| 2+ | 3,322 | 1619-1610-93 | 50.14% | 40.85% | +2.8 |
| 3+ | 1,817 | 919-854-44 | 51.83% | 37.64% | +4.0 |
| 4+ | 1,038 | 519-502-17 | 50.83% | 33.72% | +5.0 |
| 5+ | 633 | 327-297-9 | 52.40% | 31.75% | +5.9 |
| 6+ | 387 | 201-182-4 | 52.48% | 30.49% | +6.3 |
| 7+ | 235 | 130-105-3 | 55.32% | 29.41% | +6.8 |
Teams that lost seven straight covered 55.32 percent of the time. That's the best number in this study for a one-sided streak, and it's about 1.6 standard deviations from 50 percent. It's suggestive, not proven.
The detail matters more than the headline. Teams on four-game losing streaks covered 52.15 percent as underdogs but only 46.53 percent as favorites. When the market still favors a team that has lost four straight, it usually means the market thinks the team is better than its recent results. Those teams didn't deliver. As 7-point or bigger favorites on a four-game skid, they went 11-15.
What Happens When a Hot Team Plays a Cold Team?
This is the strongest result in the study.
| Matchup | ATS record (hot team) | Hot team cover rate | Games |
|---|---|---|---|
| 2+ win streak vs. 2+ losing streak | 414-438-23 | 48.59% | 875 |
| 3+ win streak vs. 3+ losing streak | 109-144-5 | 43.08% | 258 |
| 4+ win streak vs. 4+ losing streak | 44-53-2 | 45.36% | 99 |
When a team on a three-game winning streak played a team on a three-game losing streak, the hot team won 68.6 percent of the time but covered only 43.08 percent. The average spread was 7.9 points, and the hot team's average margin was 7.0. That's the market overreacting to two streaks at once, and it's about 2.2 standard deviations from 50 percent.
The split by spread is sharper still. Hot teams favored by less than 7 points in these games went 24-44-3 against the spread, a 35.29 percent cover rate. When the hot team was the underdog, it was 12-12.
But this one comes with a big warning. It hasn't been steady across eras:
| Era | Hot team ATS, 3+ vs. 3+ | Cover rate |
|---|---|---|
| 1999-2008 | 41-56-2 | 42.27% |
| 2009-2017 | 42-35-1 | 54.55% |
| 2018-2025 | 26-53-2 | 32.91% |
For nine seasons in the middle, the hot team covered more often than not. Then 2018 through 2025 went 26-53. There are only 6 to 18 of these games a season, so a few years of results can swing the whole trend. We'd treat it as a reason to look at the cold team, not as an automatic bet.
Has the Market Caught Up on Streaks?
Mostly, yes. Here are the four-game streaks by era:
| Era | 4+ win streak ATS | 4+ losing streak ATS |
|---|---|---|
| 1999-2008 | 49.14% | 53.06% |
| 2009-2017 | 48.63% | 47.58% |
| 2018-2025 | 49.84% | 51.94% |
There's no era where riding a win streak paid. Fading a losing streak worked in the early years and in 2018 through 2025, but not in between. The late-season numbers are a little more interesting. From Week 13 on, teams on four-game win streaks covered just 45.82 percent (203-240-10). That's when the public has watched the streak build for a month and the playoff race is in the headlines.
This season, the streak rules haven't held. Teams on three-game win streaks are 12-13 against the spread in 2026, and teams on three-game losing streaks are 11-15-3. That's 54 games, which is too few to say much in either direction.
Which Week 10 Games Fit the Streak Spots?
These are the streaks entering Week 10, with the closing-line feed in the nflverse games file as of Thursday, Nov. 12. Lines move, so check the number before kickoff.
| Game | Streak situation | Spread in dataset |
|---|---|---|
| Bills at Jets | Bills won 4 straight; Jets lost 4 straight | Bills -8.5 |
| Bengals vs. Steelers | Both on 4-game win streaks | Bengals -3.5 |
| Patriots at Lions | Lions won 4 straight | Lions -2.5 |
| Chargers at Ravens | Chargers lost 8 straight; Ravens lost 4 straight | Ravens -4.5 |
| Dolphins at Colts | Colts lost 5 straight | Colts -3.5 |
Bills at Jets is the clean hot-versus-cold game, and it fits the 4+ vs. 4+ group (45.36 percent for the hot team). But Buffalo is favored by 8.5, and the sharpest part of this trend was in games under 7 points. Indianapolis is the other spot to watch. A team on a five-game losing streak that's still favored is the "favorite on a skid" group that covered 46.53 percent.
The longest skid on a bye belongs to the Eagles (seven straight losses), who return against Pittsburgh in Week 11. Our weekly NFL picks against the spread cover how these play out.
Why Does This Matter if You Pay for Picks?
Streaks are easy to sell. A service can post "Bills are 4-0 in their last four, ride them" and it sounds like analysis. This study shows why that's worthless: the market already raised the price to match the streak. The edge isn't in knowing a team is hot. It's in knowing when the number has gone too far.
That's the question to ask any service you're thinking about. If you're looking for NFL expert picks, look for reasons that go beyond recent results, and look for a full, public record. Our football handicappers page explains how we pick games, and our sports handicapping service page explains how the service works. The Best Bet on Sports is limited on all six major U.S. sportsbooks for winning at live betting, and the same approach drives our work as basketball handicappers. The early-season version of this question is in what a hot ATS start predicts.
What This Study Doesn't Cover
This study uses closing spreads and regular-season games from 1999 through 2025. Streaks are straight-up wins and losses within a season, not ATS streaks. It doesn't adjust for injuries, quarterback changes, opponent strength or rest. The hot-versus-cold group is small (258 games over 27 seasons) and has swung by era, so it shouldn't be bet blindly. The 2026 streaks and spreads come from the nflverse games file as of Nov. 12, and spreads for unplayed games can change.
Get Tonight's Live Picks
Want live in-game NFL calls, including second-half spots when a streaking favorite's live line has run too far, sent to your phone during the game?
The Best Bet on Sports is the only live betting handicapping service limited on all six major U.S. sportsbooks (FanDuel, DraftKings, Caesars, BetMGM, Fanatics, ESPN BET) for winning too much during in-game action. Verified profit: $367,520+. Live calls go out through Email and Discord during games, and every bet in the $10,000 to $100,000 challenge is posted as it happens.
→ Join The Best Bet on Sports community — newsletter, live stream and Discord → Try a free live pick first — reserve your spot for tonight's pick
Frequently Asked Questions
Do NFL teams on winning streaks cover the spread?
No. From 1999 through 2025, teams on four-game winning streaks went 490-506-29 against the spread, a 49.20 percent cover rate. They won 63.61 percent of those games straight up, but the spread rose with the streak. Their average margin was 4.38 points against an average spread of 4.25, so the market priced them almost exactly.
Should you bet on NFL teams on long losing streaks?
There's a lean, not a rule. Teams on seven-game losing streaks covered 55.32 percent of the time (130-105-3), and teams on five-game skids covered 52.40 percent. Losing-streak teams did better as underdogs (52.15 percent on four-game skids) than as favorites (46.53 percent). The samples are small enough that variance explains part of it.
What happens ATS when a hot NFL team plays a cold team?
The cold team has covered more often. When a team on a three-game win streak played a team on a three-game losing streak, the hot team covered only 43.08 percent (109-144-5) from 1999 through 2025. Hot teams favored by less than 7 went 24-44-3. The trend has swung by era, though: 54.55 percent for the hot team from 2009 through 2017.
How much does a winning streak move the NFL point spread?
About half a point to a point per win. Teams on two-game win streaks were favored by an average of 2.6 points, and teams on seven-game streaks by 5.9. Teams on losing streaks moved the other way, from 2.8-point underdogs after two losses to 6.8-point underdogs after seven.
Do winning streaks matter more late in the NFL season?
The late-season numbers are worse for hot teams. From Week 13 on, teams on four-game winning streaks covered just 45.82 percent (203-240-10). From Week 10 on, they covered 47.77 percent. Teams on four-game losing streaks were near 50 percent in both windows.
How are streak teams doing against the spread in 2026?
Not the way history suggests. Through Week 9, teams on three-game win streaks are 12-13 against the spread, and teams on three-game losing streaks are 11-15-3. That's 54 games, which is too small a sample to change the long-run numbers.
Which Week 10 games fit the NFL streak trends?
Bills at Jets is the clearest hot-versus-cold spot: Buffalo has won four straight and New York has lost four, with Buffalo -8.5 in the dataset. The Colts, on a five-game losing streak, are 3.5-point favorites against Miami. The Bengals and Steelers both bring four-game win streaks. Check current lines before kickoff, because spreads move.
The Best Bet on Sports · 1.5M followers on TikTok
Sports Betting TikTok is the live betting account behind The Best Bet on Sports, covering NFL, NCAAF, NBA, NCAAB, MLB and WNBA markets in real time. The account has been limited on all six major U.S. sportsbooks — FanDuel, DraftKings, Caesars, BetMGM, Fanatics and ESPN BET — for winning on live betting, with $367,520 in verified profit since 2005. View full profile →
Past results do not guarantee future performance. Must be 21 or older to wager.
Related Articles
NFL Teams That Won While Outgained, Tested
NFL Point Differential vs. Record: Does It Beat the Spread?
NFL Favorites With Worse Records: Should You Fade Them?
NFL Teams After an Upset Loss, Tested
2026 NFL Draft Betting Odds: Who Goes No. 1 and the Best Prop Bets
Live Betting Strategy for NFL Games: How Sharps Attack In-Game Lines
Get real live betting picks
From $39.95/mo · Cancel anytime · Email + Discord delivery
● Get The Picks
Choose your package
Tap any tier below to select · Subscribe in one tap
👇 Tap any package to select it
✓ You're selecting
25 Units · $99.95/month
25 unit picks per month. Sweet spot for most bettors — plenty of action without going all-in.
- ✓25 live betting selections/month
- ✓Email + Discord delivery
- ✓All sports (NFL, NCAAF, NBA, NCAAB, MLB)
- ✓Mix of 1, 2, 3, 5-unit rated plays
- ✓Cancel anytime
Secure PayPal · Cancel anytime · No hidden fees · 21+ · +$367K verified
+$367,520 verified · Limited on 6 sportsbooks · 20 years documented · See Proof
Join Our Newsletter
Get free expert sports picks and analysis delivered weekly.