NFL Field Goal Props, Tested

NFL field goal props have shifted toward distance, not volume. Made field goals per game rose only from 3.24 in 2016-19 to 3.49 in 2026, but the longest make cleared 49.5 yards in 52.07 percent of 2026 games, up from 31.05 percent. Field goal counts barely move with the game total, so they add almost no correlation to a same-game parlay.
NFL field goal props have changed in one direction: distance. Made field goals per game barely moved, from 3.24 in 2016-19 to 3.32 in 2020-25 and 3.49 through Week 8 of 2026, but the longest made field goal cleared 49.5 yards in 52.07 percent of 2026 games, up from 31.05 percent in 2016-19. We also found that field goal counts are close to independent of the game total, so a kicking prop adds almost no correlation to a same-game parlay. The Best Bet on Sports has built a verified $367,520+ in profit across all sportsbooks over more than twenty years by measuring markets like this before betting them.
Field goal props are easy to overlook. They sit below the player props, they don't have a star attached, and most bettors add them to a parlay because the price looks friendly. We wanted to answer three questions from the play-by-play record: how many field goals actually get made, how far the longest one goes, and whether either number moves with the game total in the way a parlay builder assumes.
How Did We Test Field Goal Props?
We used every NFL regular-season play from 2016 through Week 8 of 2026 in the nflverse play-by-play files. That is 2,639 games from 2016 through 2025 and 121 games so far in 2026. For each game we counted field goal attempts, made field goals and the distance of the longest make, then joined those to the closing total and spread in the same file.
Two definitions matter. "Total field goals" means made field goals by both teams, which is how most sportsbooks grade the market. "Longest field goal" means the longest successful kick in the game, so a game with no made field goal grades under on any longest-field-goal line. We did not have historical prop prices, so every percentage below is the actual hit rate, and the odds shown are the fair price that hit rate implies with no margin.
How Many Field Goals Are Made in an NFL Game?
The answer is more stable than most bettors expect. Here is how the full 2016-25 sample breaks down.
| Made field goals in the game | Share of games, 2016-25 |
|---|---|
| 0 | 2.92% |
| 1 | 10.57% |
| 2 | 19.74% |
| 3 | 25.69% |
| 4 | 18.34% |
| 5 | 13.34% |
| 6 | 5.34% |
| 7 or more | 4.05% |
Three made field goals is the single most common outcome, and four or fewer covers about 77 percent of games. The usual market number is 3.5, and that is where the trend shows up.
| Total field goals line | 2016-19 | 2020-25 | 2026 (thru Wk 8) |
|---|---|---|---|
| Over 2.5 made | 65.14% | 67.80% | 70.25% |
| Over 3.5 made | 39.55% | 42.04% | 45.45% |
| Over 4.5 made | 21.58% | 23.47% | 23.97% |
| Average made per game | 3.24 | 3.32 | 3.49 |
| Average attempts per game | 3.87 | 3.91 | 4.17 |
Over 3.5 made field goals has drifted from about 40 percent to about 45 percent. A 45.45 percent hit rate is a fair price of +120, so an over 3.5 at +130 or longer is the kind of number worth a closer look. Keep the sample in mind, though: 121 games carries a margin of error of roughly four and a half points either way, so the 2026 column is a direction, not a settled rate.
Field goals also make up a slightly larger share of scoring than they used to: 21.46 percent of all points in 2016-19, 21.80 percent in 2020-25 and 22.69 percent so far in 2026.
Are Longest Field Goal Props Moving?
Yes, and by far more than the totals market. Kickers are attempting long field goals much more often, and coaches are sending them out from distances that used to mean a punt.
| Longest made field goal | 2016-19 | 2020-25 | 2026 (thru Wk 8) | 2026 fair price |
|---|---|---|---|---|
| Over 44.5 yards | 55.47% | 61.80% | 68.60% | -218 |
| Over 46.5 yards | 46.29% | 53.44% | 62.81% | -169 |
| Over 47.5 yards | 41.21% | 50.34% | 59.50% | -147 |
| Over 49.5 yards | 31.05% | 40.93% | 52.07% | -109 |
| Over 50.5 yards | 24.32% | 36.59% | 44.63% | +124 |
The number of 50-plus yard attempts tells the same story. In 2016 there were 0.59 attempts from 50 yards or longer per game. By 2024 it was 1.03, in 2025 it was 0.98, and through eight weeks of 2026 it is 1.11. Teams are attempting nearly twice as many long field goals as they were a decade ago.
Accuracy from that range has improved too, but it hasn't kept rising. Kickers made 56.7 percent of 50-plus attempts in 2016, 69.9 percent in 2024, 68.8 percent in 2025 and 66.4 percent so far this season. Overall field goal accuracy has stayed in a narrow band, from 84.2 percent in 2016 to 85.6 percent in 2025 and 83.7 percent this year. The trend is not that kickers got dramatically better at every distance. It is that teams are trying more long kicks, so the longest make in a game is pushed further out.
What this means for a bettor: a longest-field-goal line set where it would have been in 2018 is an over by the current data. A 47.5-yard line priced near even money implies about 50 percent, and 2026 games are clearing it close to 60 percent of the time. Sportsbooks do adjust these lines game by game for the kickers involved, so the real question for any single prop is whether that game's number has caught up with the league-wide shift.
Do Field Goal Props Correlate With the Game Total?
This is where most parlay builders go wrong. The instinct is that a field-goal-heavy game is a stalled, low-scoring game, so an over on field goals belongs with an under on the total. Or the reverse: more points, more kicks, so field goal overs pair with game overs. The data supports neither.
| Made field goals in the game | Games | Game went over the total |
|---|---|---|
| 0-1 | 353 | 54.11% |
| 2 | 517 | 43.52% |
| 3 | 674 | 52.82% |
| 4 | 480 | 44.58% |
| 5 or more | 594 | 49.83% |
| All games | 2,618 | 48.97% |
The over rate zig-zags with no direction. Games with five or more made field goals went over 49.83 percent of the time, which is almost exactly the overall rate. The average closing total was between 45.0 and 45.6 in every row, so the market wasn't setting different totals for these games either.
The joint rates confirm it:
| Parlay pairing, 2016-25 | Actual joint rate | Rate if fully independent |
|---|---|---|
| Over 3.5 made FG + game under | 21.54% | 20.93% |
| Over 3.5 made FG + game over | 19.48% | 20.09% |
| Longest FG over 47.5 + game over | 23.19% | 22.89% |
| Longest FG over 47.5 + game under | 23.57% | 23.86% |
Every pairing lands within about six-tenths of a point of what two unrelated coin flips would produce. There is a faint tilt toward field goal overs with game unders, but it is far too small to build a parlay on.
The game total doesn't predict field goal volume much either. Games closing at 40.5 or lower averaged 3.29 made field goals. Games at 41 to 44.5 averaged 3.33, 45 to 48.5 averaged 3.32, and 49 or higher averaged 3.20. The highest totals actually had the lowest over 3.5 rate, 37.21 percent, because those offenses finish more drives in the end zone.
The point spread matters a little more. Games with a spread of 3.5 to 6.5 averaged 3.41 made field goals and went over 3.5 in 43.29 percent of games. Games with a spread of 10 or more averaged 3.07 and went over 3.5 only 36.92 percent of the time. Lopsided games produce fewer kicks, likely because the trailing team is going for it on fourth down and the leading team is running out the clock.
How Should You Use Field Goal Props in a Parlay?
Treat them as independent legs. That has two consequences.
First, a field goal prop doesn't make a parlay "smarter." When you pair a quarterback's passing yards with his top receiver's yards, you are combining outcomes that move together, and that is the case covered in correlated parlays explained. A field goal prop paired with the game total doesn't move together, so it simply multiplies two separate prices. Each leg has to be a good bet on its own.
Second, independence makes the math honest. If a longest-field-goal over 47.5 really hits close to 60 percent this season and you can get it near even money, it is a positive-value leg whether it sits alone or in a parlay. If you can only get it at -150, it is roughly a fair bet, and adding it to a parlay adds margin without adding edge.
A short checklist before you add one:
- Check the line against the era, not your memory. A 44.5-yard longest field goal line cleared 68.60 percent of the time this season.
- Check the spread. Double-digit spreads cut field goal volume, so an over 3.5 in a 10-point game is a weaker bet than the same line in a field-goal game.
- Don't buy the "low-scoring game means more kicks" story. The 2016-25 data shows no meaningful link between field goal count and the game total.
- Watch the hook. Total field goals is a small-number market, so the difference between 3.5 and 4.5 is huge. The over 4.5 hit only 21.58 to 23.97 percent of the time across the three periods.
Where This Analysis Stops
These are hit rates against fixed lines, not results against actual sportsbook prices, because historical prop prices aren't in the public data. A 59.50 percent hit rate on over 47.5 only matters if a book is offering a price longer than -147.
The 2026 column covers 121 games. Its direction matches the ten-year trend, which is a reason to take it seriously, but the exact percentages will move as the season fills in. The study also measures the league as a whole. Individual kickers, coaching tendencies and game scripts all shift a single game's number, which is why each prop still has to be priced on its own.
For how field goals change live drive pricing, see our breakdown of live betting field goals vs. touchdowns. For the weekly football board, our football betting picks and NFL picks pages carry the current card, and our expert sports picks page explains how we decide which markets are worth betting. The same price-first approach runs through our basketball handicappers page now that the NBA season is underway.
Get Tonight's Live Picks
Want live in-game NFL prop and parlay calls, including field goal spots, sent to your phone during the game?
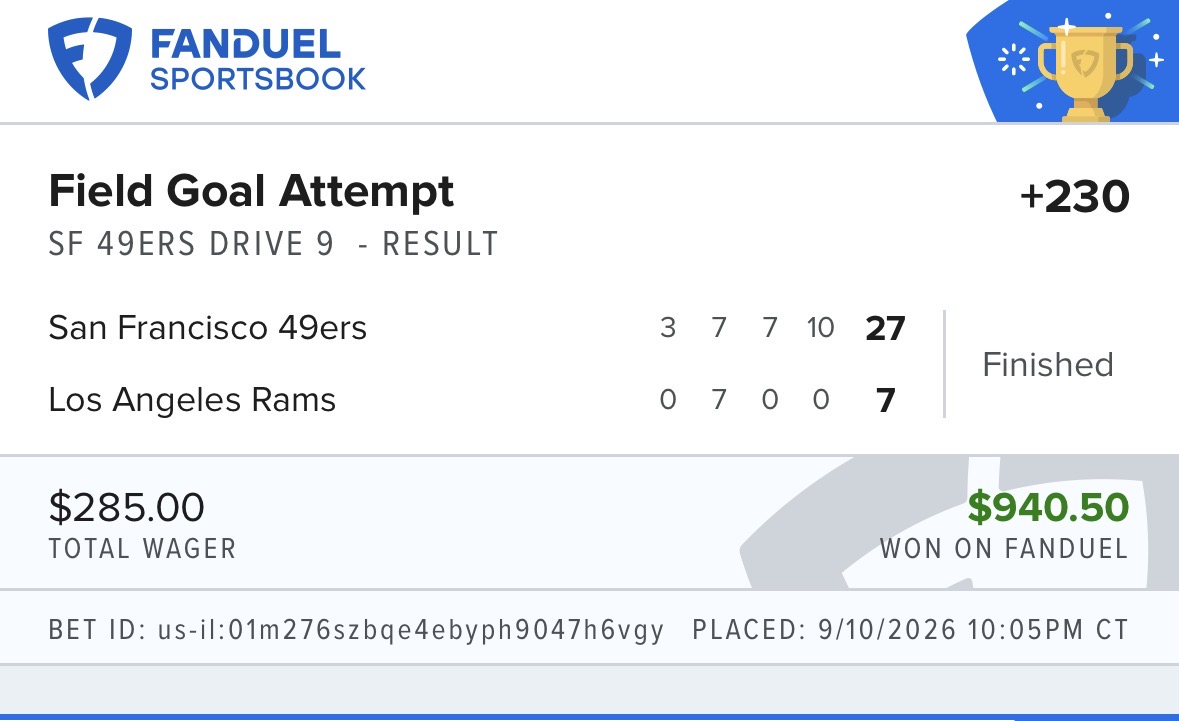
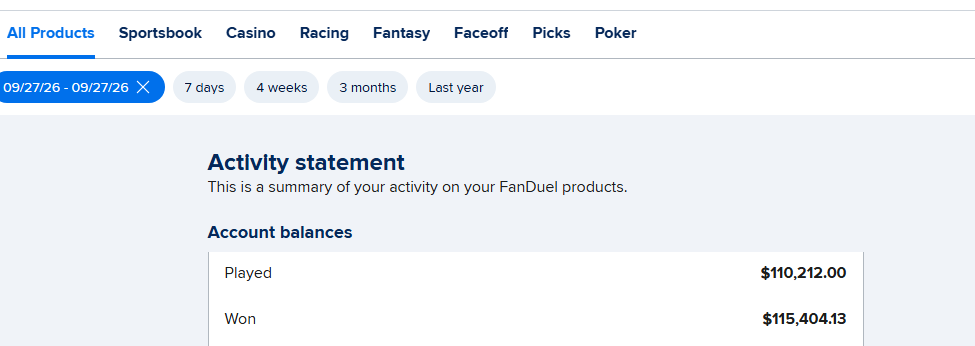
The Best Bet on Sports is the only live betting handicapping service limited on all six major U.S. sportsbooks (FanDuel, DraftKings, Caesars, BetMGM, Fanatics, ESPN BET) for winning too much during in-game action. Verified profit: $367,520+. Live calls go out through Email and Discord during games, and every bet in the $10,000 to $100,000 challenge is posted as it happens.
→ Join The Best Bet on Sports community — newsletter, live stream and Discord → Try a free live pick first — reserve your spot for tonight's pick
For more on how we work during games, see our live betting picks page.

Frequently Asked Questions
How many field goals are made in an average NFL game?
About three and a half. NFL games averaged 3.24 made field goals in 2016-19, 3.32 in 2020-25 and 3.49 through Week 8 of 2026. Three made field goals is the most common single outcome, at 25.69 percent of games from 2016 through 2025.
How often does an NFL game go over 3.5 made field goals?
It went over 3.5 in 39.55 percent of games in 2016-19, 42.04 percent in 2020-25 and 45.45 percent through eight weeks of 2026. A 45.45 percent rate is a fair price of about +120, so an over 3.5 needs a price longer than that to carry value.
Are longest field goal props going over more often?
Yes. The longest made field goal cleared 49.5 yards in 31.05 percent of games in 2016-19, 40.93 percent in 2020-25 and 52.07 percent so far in 2026. Teams now attempt about 1.1 field goals of 50 yards or longer per game, close to double the 2016 rate.
Do field goal props correlate with the over/under?
Barely. From 2016 through 2025, over 3.5 made field goals plus the game under hit 21.54 percent of the time, against 20.93 percent if the two were fully independent. Games with five or more made field goals went over the total 49.83 percent of the time, almost the same as the 48.97 percent rate for all games.
Should I pair a field goal over with a game under in a same-game parlay?
Only if both legs are good bets on their own. The data shows almost no link between field goal volume and the game total, so the pairing doesn't add the correlation many bettors assume it does. It multiplies two separate prices, and each one has to stand up independently.
Does the point spread affect total field goals?
Somewhat. Games with a spread of 3.5 to 6.5 went over 3.5 made field goals 43.29 percent of the time, while games with a spread of 10 or more went over only 36.92 percent of the time. Lopsided games tend to produce fewer kicks as the trailing team goes for it on fourth down.
What happens to a longest field goal bet if no field goal is made?
At most sportsbooks it grades as under, because the longest made field goal is treated as zero. That happened in 1.65 percent of 2026 games through Week 8 and 2.41 percent of games in 2020-25. Check your book's house rules, since grading can vary.
The Best Bet on Sports · 1.5M followers on TikTok
Sports Betting TikTok is the live betting account behind The Best Bet on Sports, covering NFL, NCAAF, NBA, NCAAB, MLB and WNBA markets in real time. The account has been limited on all six major U.S. sportsbooks — FanDuel, DraftKings, Caesars, BetMGM, Fanatics and ESPN BET — for winning on live betting, with $367,520 in verified profit since 2005. View full profile →
Past results do not guarantee future performance. Must be 21 or older to wager.
Related Articles
Score First and Win: NFL Parlay Data
Favorite and Over Parlays: 11 Years of Real Results
First Half Over, Game Under: The Parlay That Fights Itself
Defensive TD Parlay Props, Tested
Race to 20 Points Parlays, Tested
NFL Highest-Scoring Half, Tested
Get real live betting picks
From $39.95/mo · Cancel anytime · Email + Discord delivery
● Get The Picks
Choose your package
Tap any tier below to select · Subscribe in one tap
👇 Tap any package to select it
✓ You're selecting
25 Units · $99.95/month
25 unit picks per month. Sweet spot for most bettors — plenty of action without going all-in.
- ✓25 live betting selections/month
- ✓Email + Discord delivery
- ✓All sports (NFL, NCAAF, NBA, NCAAB, MLB)
- ✓Mix of 1, 2, 3, 5-unit rated plays
- ✓Cancel anytime
Secure PayPal · Cancel anytime · No hidden fees · 21+ · +$367K verified
+$367,520 verified · Limited on 6 sportsbooks · 20 years documented · See Proof
Join Our Newsletter
Get free expert sports picks and analysis delivered weekly.