NFL Lead Changes Prop: How Often the Lead Really Flips

In the NFL lead changes prop, 43.39 percent of 2016-2025 regular-season games had no lead change at all, so over 0.5 lead changes hit 56.61 percent (fair price about -130). Over 1.5 hit 32.70 percent (+206) and over 2.5 hit 19.06 percent (+425). Games with four or more lead changes went over the total 70.11 percent of the time.
In the NFL lead changes prop, the most common answer is zero. Across 2,639 regular-season games from 2016 through 2025, 43.39 percent had no lead change at all: one team took the lead and never gave it up. That makes over 0.5 lead changes a 56.61 percent result, a fair price of about -130. Over 1.5 lead changes hit 32.70 percent of the time (+206), over 2.5 hit 19.06 percent (+425), and over 3.5 hit 10.31 percent (+870). The Best Bet on Sports has built a verified $367,520+ in profit across all sportsbooks over more than twenty years, and game-flow props like this one are where the live number and the real odds drift apart most often.
Lead changes feel like a coin-flip market. Most bettors picture a back-and-forth game and lean over. The data says the typical NFL game is much more one-sided than that. One team scores first, keeps the lead, and the other team spends the afternoon chasing.
We built this study from nflverse play-by-play data. For every regular-season game from 2016 through 2025, we tracked the score after every play and counted each time the lead passed from one team to the other. A tie doesn't count as a lead change. If Team A leads 7-0, the game is tied 7-7, and then Team B goes up 14-7, that's one lead change, not two. Most sportsbooks grade this prop the same way, but some count a tie as a change. Read your book's rules before you bet. The final scores in our play-by-play data matched the official results in 99.1 percent of games, and overtime is included.
How Many Lead Changes Happen in a Typical NFL Game?
Here is the full distribution from ten seasons of games:
| Lead changes | Share of games, 2016-25 | Fair odds for exactly this many |
|---|---|---|
| 0 | 43.39% | +130 |
| 1 | 23.91% | +318 |
| 2 | 13.64% | +633 |
| 3 | 8.75% | +1043 |
| 4 | 4.43% | +2157 |
| 5 | 2.96% | +3278 |
| 6 or more | 2.92% | +3325 |
The average game had 1.31 lead changes, and the median was one. That gap between mean and median comes from a long tail. A handful of wild games with five, six or more lead changes pull the average up, while the typical game has none.
Here are the over lines you'll usually see:
| Line | Over hit rate | Fair over price | Fair under price |
|---|---|---|---|
| Over 0.5 | 56.61% | -130 | +130 |
| Over 1.5 | 32.70% | +206 | -206 |
| Over 2.5 | 19.06% | +425 | -425 |
| Over 3.5 | 10.31% | +870 | -870 |
If your book posts 1.5 lead changes with both sides near -110, the under is the side the history favors by a wide margin. A 32.70 percent over is nowhere near a 50-50 market.
Are Lead Changes Becoming More Common?
Yes, a little.
| Period | Games | Avg lead changes | No lead change | Over 1.5 |
|---|---|---|---|---|
| 2016-2019 | 1,024 | 1.19 | 46.09% | 32.03% |
| 2020-2025 | 1,615 | 1.39 | 41.67% | 33.13% |
| 2026 to date | 137 | 1.47 | 41.61% | 32.12% |
Games have gotten a bit more competitive since 2020. The no-lead-change share dropped about four and a half points. But look at the over 1.5 column. It barely moved. The extra lead changes mostly turn zero-change games into one-change games. They don't create many more back-and-forth shootouts. This season is running close to the 2020-2025 average.
Does the Point Spread Change the Lead Changes Odds?
It does, and more than the total does.
| Closing spread | Games | Avg lead changes | No lead change | Over 1.5 | Avg largest lead |
|---|---|---|---|---|---|
| 0 to 2.5 | 609 | 1.44 | 39.90% | 36.29% | 15.2 |
| 3 to 6.5 | 1,277 | 1.33 | 42.21% | 33.05% | 16.0 |
| 7 to 9.5 | 425 | 1.30 | 44.71% | 31.06% | 17.5 |
| 10 or more | 328 | 1.02 | 52.74% | 26.83% | 19.3 |
When the spread is 10 or more, more than half of games have no lead change at all. In pick'em games, it's about 40 percent. Even in the closest-priced games, over 1.5 lead changes only hits 36.29 percent. There's no spread band where the over is close to a coin flip.
The largest-lead column shows why. Bigger favorites build bigger leads, and a team up 17 doesn't give the lead back very often.
Does the Game Total Matter?
Some, but less than you'd think.
| Closing total | Games | Avg lead changes | No lead change | Over 1.5 |
|---|---|---|---|---|
| 40.5 or lower | 394 | 1.21 | 45.43% | 32.23% |
| 41 to 44.5 | 887 | 1.28 | 46.34% | 31.23% |
| 45 to 48.5 | 834 | 1.31 | 41.85% | 32.73% |
| 49 or higher | 524 | 1.47 | 39.31% | 35.50% |
High-total games have more scoring, so they have more chances for the lead to flip. But the gap between the lowest band and the highest is only about three points on the over 1.5 line. The total helps a little. The spread helps more.
How Often Does the Underdog Ever Lead?
This is the version of the prop that hides inside a lot of parlays.
The underdog led at some point in 69.07 percent of games. The favorite won 66.30 percent of the time. But the favorite won without the underdog ever leading in only 30.82 percent of games. That's the "wire-to-wire favorite" result, and it's much rarer than most bettors expect.
| Closing spread | Underdog led at some point | Favorite won | Favorite won, dog never led | Favorite won after dog led |
|---|---|---|---|---|
| 0 to 2.5 | 79.67% | 53.06% | 20.17% | 41.29% |
| 3 to 6.5 | 69.93% | 64.13% | 29.91% | 48.94% |
| 7 to 9.5 | 64.24% | 76.24% | 35.76% | 63.00% |
| 10 or more | 52.44% | 86.28% | 47.56% | 73.84% |
Even a double-digit favorite trails at some point in more than half its games. That matters for live betting. If you bet a big favorite before the game and it falls behind early, that's normal. A 10-point favorite that trails still won 73.84 percent of the time. The live moneyline after an early deficit often overreacts to that.
How Do Lead Changes Fit in a Same-Game Parlay?
This is where the prop gets useful for same-game parlays. Lead changes and the over move together.
| Lead changes | Games | Game went over |
|---|---|---|
| 0 | 1,135 | 41.41% |
| 1 | 625 | 46.88% |
| 2 | 358 | 53.63% |
| 3 | 229 | 59.83% |
| 4 or more | 271 | 70.11% |
| All games | 2,618 | 48.97% |
(Games that pushed on the total are left out of this table.)
Pairing over 1.5 lead changes with the over hit 19.82 percent of the time. If the two legs were independent, they'd hit together only 16.05 percent of the time. That's a strong positive correlation. A book that prices those legs separately in a same-game parlay is paying you too much on the combination. Pairing "both teams to lead" (the same thing as over 0.5 lead changes) with the over hit 31.02 percent, against 27.74 percent if independent.
The flip side works too. A game with no lead change went over only 41.41 percent of the time. Under 0.5 lead changes plus the under is also a correlated pair.
Many books block the most obvious correlated combinations. When they allow them, these are the pairings worth checking. We've tested other game-flow pairings the same way, including halftime lead and win and the highest-scoring quarter.
What Is the Largest Lead in a Typical NFL Game?
Some books offer a "largest lead" prop alongside lead changes. Here's how often the biggest lead in a game cleared common lines:
| Largest lead over | Hit rate |
|---|---|
| 10.5 points | 73.25% |
| 13.5 points | 60.74% |
| 14.5 points | 49.15% |
| 16.5 points | 43.31% |
| 17.5 points | 34.75% |
| 20.5 points | 26.15% |
The median largest lead was exactly 14 points, and the average was 16.44. That makes 14.5 almost a perfect 50-50 line. The jump between 13.5 and 14.5 is big because 14 is two touchdowns, the most common lead size in the league. If your book posts the largest lead at 13.5, the over is hitting about 61 percent historically.
What About Overtime Games?
There were 145 overtime games in the sample. They averaged 2.25 lead changes, almost one more than the league average. That makes sense: a game that goes to overtime usually had a late tying score, and many have a lead change in the extra period. Overtime counts in most books' lead-change grading, but check the house rules.
How Should You Bet the Lead Changes Prop?
Four rules come straight from the numbers.
1. Lean under 1.5 unless the price is long. Over 1.5 hits about one game in three. If the over is priced shorter than +206, history says you're paying too much.
2. Over 0.5 is a fair fight near -130. "Both teams to lead" hits 56.61 percent. At -110, that's a good price. At -150, it isn't.
3. Adjust for the spread, not the total. A 10-point favorite pushes the no-lead-change share above half. A pick'em game drops it to about 40 percent.
4. Pair lead changes with the total in the same direction. Over lead changes and the over move together. So do under lead changes and the under.
For the full side-and-total card each week, start with our football betting picks and NFL picks against the spread.
Why Does This Matter if You Pay for Picks?
Game-flow props come down to timing. A pregame card can't tell you that the leader is only up three entering the fourth quarter, or that the underdog has scored first in a game it was supposed to lose by 10. That information only shows up during the game, and the edge disappears once the live price catches up.
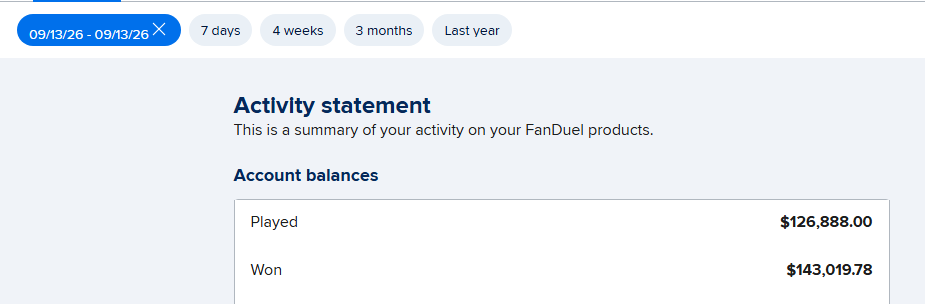
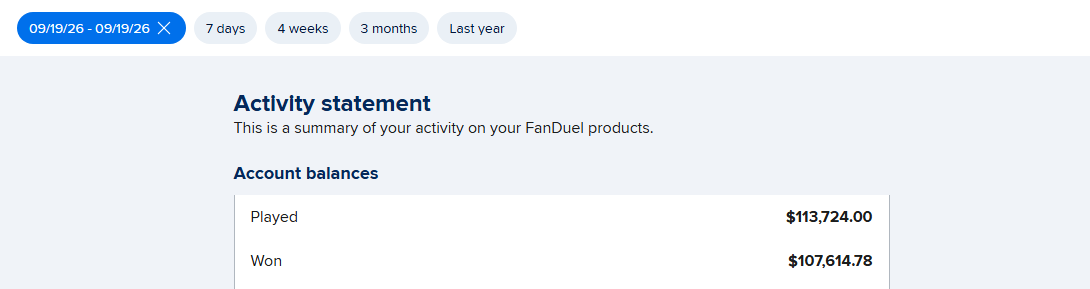
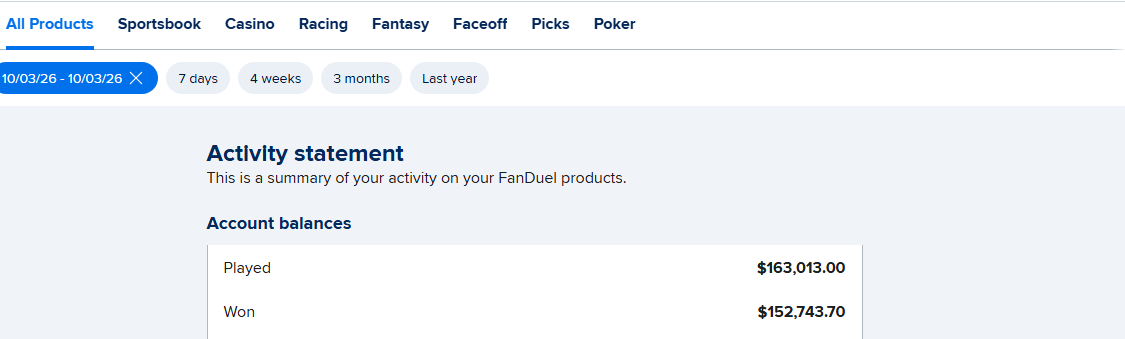
That's how The Best Bet on Sports works. We bet in-game, and we've been limited on all six major U.S. sportsbooks (FanDuel, DraftKings, Caesars, BetMGM, Fanatics and ESPN BET) for winning too much at it. If you're comparing expert sports picks services, ask whether they send live betting picks or only a pregame list. The same in-game approach drives our work as basketball handicappers, where leads change hands even faster.
What This Study Doesn't Cover
This study uses regular-season games from 2016 through 2025, plus 2026 to date. It doesn't include playoff games, and it doesn't compare against real sportsbook prices, which vary by book and by game. The fair odds are break-even prices from historical frequencies, with no vig. Lead changes were counted from the score after each play in the play-by-play data. Books that count a tie as a lead change would grade some games differently.
Get Tonight's Live Picks
Want live in-game NFL calls, including fourth-quarter spots where the live price hasn't caught up with a close game, sent to your phone during the game?
The Best Bet on Sports is the only live betting handicapping service limited on all six major U.S. sportsbooks (FanDuel, DraftKings, Caesars, BetMGM, Fanatics, ESPN BET) for winning too much during in-game action. Verified profit: $367,520+. Live calls go out through Email and Discord during games, and every bet in the $10,000 to $100,000 challenge is posted as it happens.
→ Join The Best Bet on Sports community — newsletter, live stream and Discord → Try a free live pick first — reserve your spot for tonight's pick
Frequently Asked Questions
How many lead changes are in a typical NFL game?
Usually none. From 2016 through 2025, 43.39 percent of regular-season games had no lead change, 23.91 percent had one, and 13.64 percent had two. The average was 1.31 lead changes per game and the median was one. A small number of back-and-forth games with five or more lead changes pull the average up.
What is a fair price for over 1.5 lead changes in the NFL?
About +206. Over 1.5 lead changes hit 32.70 percent of the time from 2016 through 2025, which works out to a break-even price of roughly +206 with no vig. If your book offers the over at -110 or anything shorter than +200, the price is well below what the history supports.
Does a tie count as a lead change?
At most sportsbooks, no. A lead change is usually counted only when the lead passes from one team to the other, so going from 7-0 to 7-7 to 14-7 for the other team counts as one change. This study counts lead changes that way. Some books grade it differently, so read the house rules before betting.
Do big favorites have fewer lead changes?
Yes. In games with a closing spread of 10 or more points, 52.74 percent had no lead change and the average was 1.02. In games with a spread of 0 to 2.5, only 39.90 percent had no lead change and the average was 1.44. The spread is a stronger signal for this prop than the game total.
Are lead changes correlated with the over?
Strongly. Games with four or more lead changes went over the closing total 70.11 percent of the time, and games with none went over just 41.41 percent, against a 48.97 percent baseline. Over 1.5 lead changes and the over hit together 19.82 percent of the time, compared with 16.05 percent if the two legs were independent.
How often does the underdog lead at some point in an NFL game?
In 69.07 percent of games from 2016 through 2025. Even favorites of 10 or more points trailed at some point in 52.44 percent of their games, and they still won 73.84 percent of those games. The favorite won without the underdog ever leading in only 30.82 percent of all games.
What is the average largest lead in an NFL game?
The median largest lead was 14 points, and the average was 16.44 points. The largest lead was more than 14.5 points in 49.15 percent of games, which makes 14.5 close to an even line. At 13.5, the over hit 60.74 percent of the time.
The Best Bet on Sports · 1.5M followers on TikTok
Sports Betting TikTok is the live betting account behind The Best Bet on Sports, covering NFL, NCAAF, NBA, NCAAB, MLB and WNBA markets in real time. The account has been limited on all six major U.S. sportsbooks — FanDuel, DraftKings, Caesars, BetMGM, Fanatics and ESPN BET — for winning on live betting, with $367,520 in verified profit since 2005. View full profile →
Past results do not guarantee future performance. Must be 21 or older to wager.
Related Articles
NFL Highest-Scoring Quarter Prop: How Often Each Quarter Wins
NFL Two-Point Conversion Props, Tested
NFL Safety Props, Tested: The Real Odds
Score First and Win: NFL Parlay Data
First Half Over, Game Under: The Parlay That Fights Itself
Best NFL Parlays for Thursday Night Football: One Game, No Escape Route
Get real live betting picks
From $39.95/mo · Cancel anytime · Email + Discord delivery
● Get The Picks
Choose your package
Tap any tier below to select · Subscribe in one tap
👇 Tap any package to select it
✓ You're selecting
25 Units · $99.95/month
25 unit picks per month. Sweet spot for most bettors — plenty of action without going all-in.
- ✓25 live betting selections/month
- ✓Email + Discord delivery
- ✓All sports (NFL, NCAAF, NBA, NCAAB, MLB)
- ✓Mix of 1, 2, 3, 5-unit rated plays
- ✓Cancel anytime
Secure PayPal · Cancel anytime · No hidden fees · 21+ · +$367K verified
+$367,520 verified · Limited on 6 sportsbooks · 20 years documented · See Proof
Join Our Newsletter
Get free expert sports picks and analysis delivered weekly.