NFL Red Zone TD Rate vs the Spread: The Regression Is Priced In

NFL red zone touchdown rate barely carries over within a season. Its first-half to second-half correlation was 0.148 from 2016-2025, versus 0.511 for yards per play. But betting against hot red zone teams didn't work: teams scoring touchdowns on 45% or fewer of trips covered just 46.77%, because the spread already expects the regression.
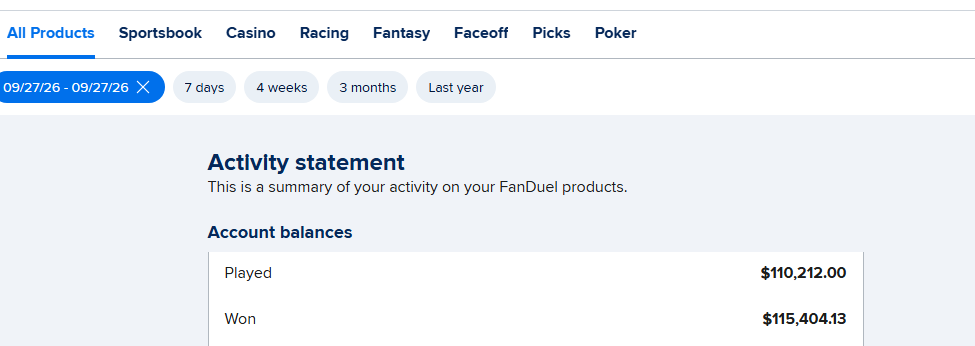
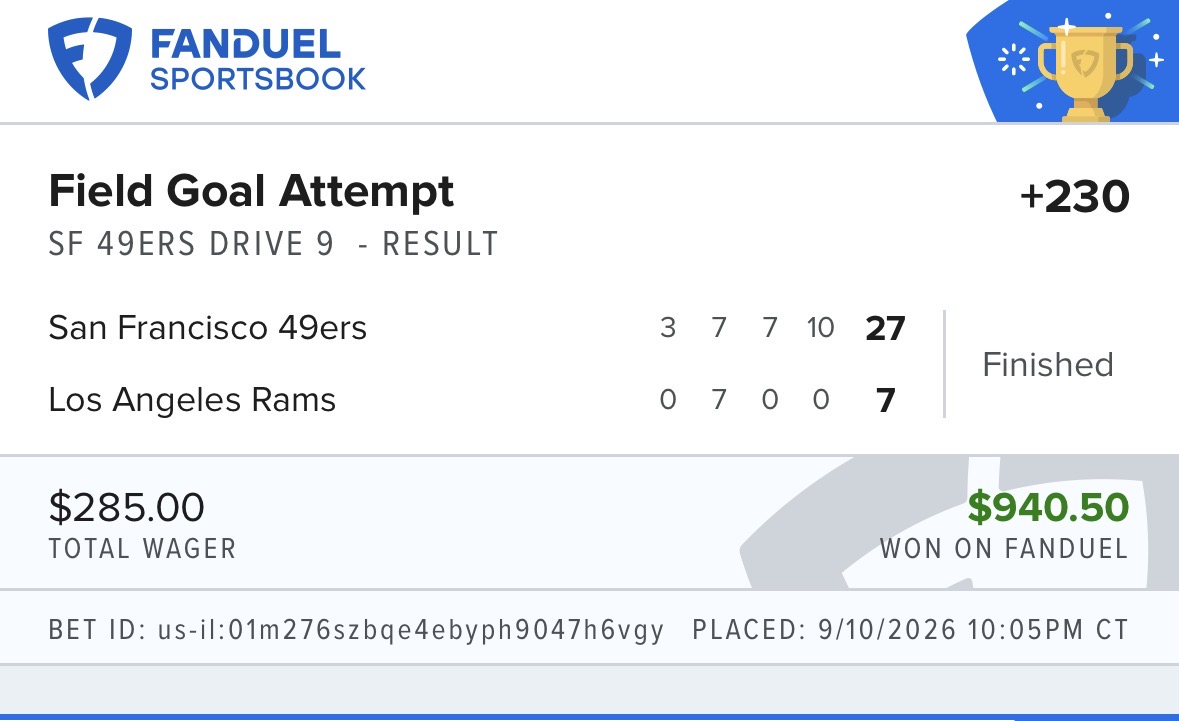
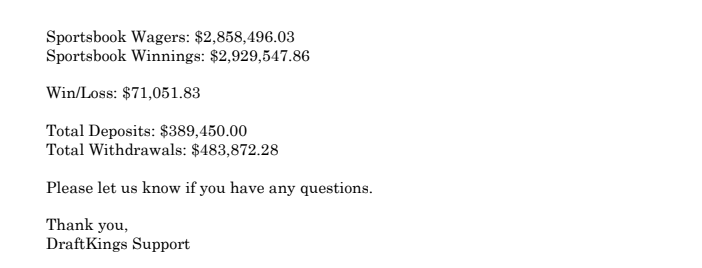
NFL red zone touchdown rate is one of the least stable numbers in football. From 2016 through 2025, a team's red zone touchdown rate over its first eight games had a correlation of just 0.148 with its rate the rest of the season, compared to 0.511 for yards per play. The worst red zone teams improved by more than 10 points and the best fell by more than 12. But betting on that regression didn't beat the spread. Teams scoring touchdowns on 45% or fewer of their trips covered only 46.77% of the time. The Best Bet on Sports has built a verified $367,520+ in profit across all sportsbooks, and this study shows why a well-known angle is rarely an edge.
Every football bettor has heard the pitch. A team keeps stalling inside the 20 and kicking field goals, so it's "due" to start scoring touchdowns. Another team is converting everything near the goal line, so it's "due" to come back to earth. The first half of that pitch is true. The second half, that you can bet it, is the part worth testing.
We used nflverse play-by-play data for every regular-season game from 2016 through 2025, with 2026 through Week 10. A red zone trip is any drive that ran at least one scrimmage play from the opponent's 20 or closer. A red zone touchdown is a trip that ended in a touchdown. Extra points and two-point tries don't count as trips. Across the sample the league scored touchdowns on 56.42% of trips and averaged 3.30 trips per team per game.
Does NFL Red Zone Touchdown Rate Carry Over?
Not much. We split each of the 320 team-seasons into the first eight games and the rest, then checked how well the first half predicted the second.
| Stat | First 8 games to rest of season (correlation) |
|---|---|
| Yards per play | 0.511 |
| Red zone trips per game | 0.442 |
| Red zone TD rate, offense | 0.148 |
| Red zone TD rate, defense | 0.126 |
How often a team gets into the red zone is a fairly stable trait. What happens once it gets there mostly isn't. A correlation of 0.148 means a half-season of red zone results tells you very little about the next half-season.
The extremes show it clearly.
| Group (first 8 games) | Red zone TD rate, first 8 | Red zone TD rate, rest of season |
|---|---|---|
| Bottom 25% of teams | 43.27% | 53.79% |
| Top 25% of teams | 69.71% | 57.20% |
| League average | 56.42% | 56.42% |
The worst teams closed most of the gap to average, and the best teams gave back most of their lead. Over a full season, red zone rate behaves a lot like luck, with a smaller amount of real skill underneath. That part of the pitch holds up.
Can You Bet Against Lucky Red Zone Teams?
Here's where it falls apart. We grouped every team-game by the team's red zone touchdown rate entering that game, with at least four games played, and checked the result against the closing spread. Pushes are excluded.
| Red zone TD rate entering game | Games | Cover rate | Average spread |
|---|---|---|---|
| 45% or lower | 511 | 46.77% | +2.31 |
| 45% to 50% | 612 | 53.10% | +0.86 |
| 50% to 55% | 661 | 46.44% | +0.67 |
| 55% to 60% | 811 | 52.16% | -0.03 |
| 60% to 65% | 528 | 50.38% | -0.79 |
| Above 65% | 770 | 50.26% | -2.21 |
| All | 3,893 | 50.01% | — |
If the market ignored red zone regression, the worst red zone teams would cover more often than average and the best would cover less. Neither happened. The worst group actually covered 46.77%, and the best group sat right at 50.26%. The rows bounce around with no pattern, which is what noise looks like. A gap of three or four points on 500 games is within normal variance.
The poor red zone teams were also priced as underdogs by an average of 2.31 points, and the best were favored by 2.21. The spread had already sorted them, and it did so knowing their red zone numbers would likely drift back.
What About the Classic Unlucky Team?
The sharper version of the angle pairs red zone rate with yardage. A team that moves the ball well but stalls near the goal line should be the best "buy low" spot. A team that scores touchdowns without moving the ball should be the best fade.
| Profile | Games | Red zone TD rate | Yards per play | Cover rate |
|---|---|---|---|---|
| Bottom-quarter red zone, above-median yards per play | 358 | 45.9% | 5.93 | 50.84% |
| Top-quarter red zone, below-median yards per play | 238 | 68.7% | 5.11 | 50.42% |
Both groups landed at a coin flip. The "unlucky" team covered 50.84% and the "lucky" team covered 50.42%. At standard -110 pricing, you need 52.38% just to break even.
Does the Spread Already Price Red Zone Regression?
Yes, and you can see it in how the numbers relate. We compared each team's red zone touchdown differential (offense minus defense) to its opponent's.
| Measure | Correlation with the closing spread | Correlation with the result against the spread |
|---|---|---|
| Red zone TD differential gap | -0.301 | 0.022 |
| Yards per play differential gap | -0.698 | 0.022 |
Both stats line up with the spread, which means the market uses them. Neither lines up with the result after the spread, which means the market uses them correctly. Yards per play has more than twice as much influence on the spread as red zone rate does, which is what you'd expect from a stat that's far more stable.
We also fit the final margin against the spread plus both gaps. After the spread, a 10-point red zone advantage was worth about 0.1 points of margin. That's not an edge. That's a rounding error.
The result held across eras. Teams below 45% covered 46.24% from 2016 through 2020 and 46.26% from 2021 through 2025.
Who Are the Red Zone Outliers in 2026?
Through Week 10, the league is converting 57.95% of red zone trips into touchdowns.
| Team | Red zone trips | TDs | TD rate |
|---|---|---|---|
| San Francisco 49ers | 30 | 25 | 83.3% |
| Philadelphia Eagles | 22 | 16 | 72.7% |
| Cincinnati Bengals | 38 | 27 | 71.1% |
| Arizona Cardinals | 35 | 15 | 42.9% |
| Cleveland Browns | 28 | 12 | 42.9% |
| New York Jets | 30 | 11 | 36.7% |
History says the 49ers won't keep scoring on five of every six trips, and the Jets won't keep scoring on barely one in three. History also says the spread knows that already. Taking the Jets because they're "due" isn't an angle. It's the same read the oddsmakers made before they posted the number.
What Does This Mean for Choosing a Handicapper?
This study is a good test for any picks service. "Regression to the mean" is real, and a lot of pick sellers use it as their whole pitch. But when an idea is common enough to be in every preview, it's in the line. A service that can't explain what it sees that the market doesn't is selling you a stat the closing number already contains.
The edges that last tend to be ones the market can't easily turn into a number, or can't adjust to fast enough. Live betting is one. A pregame spread prices the red zone over a season. A live line prices it off the score. Neither sees, in real time, that an offense has switched its goal-line package or that a defense has lost its best run stopper on the previous drive.
We've run the same check on other "unlucky team" stats. Our studies of point differential versus record and teams that won while outgained show how far each one actually goes. For the weekly card, our NFL picks against the spread and NFL expert picks pages are updated through the season, and our sports handicapping service page explains what we actually look for. For a broader look at how to judge one, see our guide to football handicappers.
Get Tonight's Live Picks
Want live in-game NFL picks sent to your phone during the game, built for the moments the live line is a step behind?
The Best Bet on Sports is the only live betting handicapping service limited on all six major U.S. sportsbooks (FanDuel, DraftKings, Caesars, BetMGM, Fanatics, ESPN BET) for winning too much during in-game action. Verified profit: $367,520+. Live calls go out through Email and Discord during games, and every bet in the $10,000 to $100,000 challenge is posted as it happens.
→ Join The Best Bet on Sports community — newsletter, live stream and Discord → Try a free live pick first — reserve your spot for tonight's pick
Frequently Asked Questions
What is a good red zone touchdown percentage in the NFL?
From 2016 through 2025, NFL teams scored touchdowns on 56.42% of red zone trips, so anything above that is above average. The top quarter of teams over a half-season converted about 70%, and the bottom quarter about 43%. Through Week 10 of 2026 the league rate is 57.95%, with the 49ers leading at 83.3% and the Jets lowest at 36.7%.
Is red zone touchdown percentage predictive in the NFL?
Only weakly. A team's red zone touchdown rate in its first eight games had a correlation of 0.148 with its rate the rest of the season from 2016 through 2025. Yards per play had a correlation of 0.511 and red zone trips per game 0.442. How often a team reaches the red zone is a much more stable trait than how well it finishes there.
Do bad red zone teams regress to the mean?
Yes. Teams in the bottom quarter of red zone touchdown rate over their first eight games averaged 43.27% and then converted 53.79% the rest of the season. Teams in the top quarter fell from 69.71% to 57.20%. Both groups moved most of the way back toward the league average of 56.42%.
Can you bet on red zone regression against the spread?
The data says no. Teams converting 45% or fewer of their red zone trips covered just 46.77% of the time from 2016 through 2025, and teams above 65% covered 50.26%. Teams that moved the ball well but struggled in the red zone covered 50.84%. Breaking even at standard -110 pricing takes 52.38%.
Does the point spread account for red zone performance?
Yes. A team's red zone differential gap against its opponent had a -0.301 correlation with the closing spread, so the market uses it. It had only a 0.022 correlation with the result against the spread, so the market uses it correctly. After the spread, a 10-point red zone advantage was worth about 0.1 points of final margin.
What NFL stat is more reliable than red zone percentage?
Yards per play. Its correlation from the first eight games to the rest of the season was 0.511 from 2016 through 2025, more than three times the 0.148 for red zone touchdown rate. Red zone trips per game, at 0.442, were also far more stable. Both are already reflected in the closing spread.
Why don't common betting angles beat the spread?
When an angle is well known and easy to calculate, oddsmakers and sharp bettors build it into the line before kickoff. Red zone regression is a good example: the worst red zone teams in this study were already priced as 2.31-point underdogs on average. Edges that last usually come from information the market can't price quickly, such as in-game changes during live betting.
The Best Bet on Sports · 1.5M followers on TikTok
Sports Betting TikTok is the live betting account behind The Best Bet on Sports, covering NFL, NCAAF, NBA, NCAAB, MLB and WNBA markets in real time. The account has been limited on all six major U.S. sportsbooks — FanDuel, DraftKings, Caesars, BetMGM, Fanatics and ESPN BET — for winning on live betting, with $367,520 in verified profit since 2005. View full profile →
Past results do not guarantee future performance. Must be 21 or older to wager.
Related Articles
Buy Teams After a Turnover Disaster? ATS Tested
Should You Fade Rookie QBs Against the Spread? Tested
Moneyline or Spread on NFL Favorites? 11 Years Tested
NFL Picks Against the Spread When a Starting QB Returns
NFL Look-Ahead Spots, Tested
Older NFL QBs Against the Spread, Tested
Get real live betting picks
From $39.95/mo · Cancel anytime · Email + Discord delivery
● Get The Picks
Choose your package
Tap any tier below to select · Subscribe in one tap
👇 Tap any package to select it
✓ You're selecting
25 Units · $99.95/month
25 unit picks per month. Sweet spot for most bettors — plenty of action without going all-in.
- ✓25 live betting selections/month
- ✓Email + Discord delivery
- ✓All sports (NFL, NCAAF, NBA, NCAAB, MLB)
- ✓Mix of 1, 2, 3, 5-unit rated plays
- ✓Cancel anytime
Secure PayPal · Cancel anytime · No hidden fees · 21+ · +$367K verified
+$367,520 verified · Limited on 6 sportsbooks · 20 years documented · See Proof
Join Our Newsletter
Get free expert sports picks and analysis delivered weekly.