NFL Picks Against the Spread When a Starting QB Returns

In NFL picks against the spread, a team whose Week 1 starting quarterback returns to the lineup went 180-185-12 ATS (49.32 percent) from 1999 to 2025 across 377 returns. After absences of four or more games, teams went 45-57-4 (44.12 percent) and won only 38.68 percent straight up. The market already prices the return, and a long layoff leaned slightly the wrong way.
In NFL picks against the spread, "the starting quarterback is back" is not an edge. From 1999 through 2025, teams whose Week 1 starter returned to the lineup after missing one or more starts went 180-185-12 against the spread (49.32 percent) across 377 returns. After absences of four or more games, they went 45-57-4 ATS (44.12 percent) and won just 38.68 percent of those games straight up. The line moves when the starter comes back, and history says it moves about the right amount. The Best Bet on Sports has built a verified $367,520+ in profit across all sportsbooks over more than twenty years, and our view is that a returning quarterback is something to watch live, not something to bet on blind before kickoff.
Every season, a handful of teams get their starter back after an injury, and every time the story is the same. The offense is whole again. The backup's bad stretch is over. Pick sellers love this spot because it's easy to explain: "Their real quarterback is back. Take them."
This year it's especially loud. Lamar Jackson had thumb surgery after his Week 8 game against Buffalo ended after one snap. Ravens coach Jesse Minter said injuries like his "typically take about 6-10 weeks to heal," Pro Football Rumors reported on Friday, and Jackson plans to return late in the season. Baltimore is 4-5. When he comes back, you'll hear the "the starter is back" pitch again.
So we tested it.
How We Measured It
We used nflverse game data for every regular-season game from 1999 through 2025, with closing spreads and the listed starting quarterback for each team. For each team-season, we took the quarterback who started Week 1. A "return" is the first game he started again after missing at least one start in a row. We counted 377 of them.
Two limits up front. First, the data doesn't say why a quarterback missed a start. Most absences are injuries, but a few are benchings or rest. Second, a starter who got hurt in Week 1 and never came back doesn't show up here, because he never had a return game. We used regular-season games only and closing spreads.
Do NFL Teams Cover When Their Starting Quarterback Returns?
No better than a coin flip.
| Return game | Games | ATS record | Cover rate | Won straight up |
|---|---|---|---|---|
| All returns, 1999-2025 | 377 | 180-185-12 | 49.32% | 43.77% |
| Every NFL team-game (baseline) | 13,934 | 6,778-6,778-378 | 50.00% | — |
The returning team won fewer than half its games straight up because these teams are usually underdogs. Many lost games during the absence, and some are playing a tough opponent by the time the starter is healthy again. The cover rate is the number that matters, and it lands right on the baseline.
Does the Length of the Absence Matter?
This is where the study gets interesting.
| Starts missed | Returns | ATS record | Cover rate | Won SU | Avg closing spread | Avg margin |
|---|---|---|---|---|---|---|
| 1 game | 145 | 70-69-6 | 50.36% | 46.90% | +0.8 | +0.24 |
| 2-3 games | 126 | 65-59-2 | 52.42% | 44.44% | +1.6 | -2.21 |
| 4+ games | 106 | 45-57-4 | 44.12% | 38.68% | +2.7 | -3.42 |
(The spread is shown from the returning team's side; a plus number means it was an underdog.)
Short absences priced fine. A quarterback who missed one game came back to a 50.36 percent cover rate. Two or three games was 52.42 percent. Those results are as close to 50-50 as this sample can show.
Long absences are a different story. Teams getting their starter back after four or more missed games covered just 44.12 percent of the time and lost by 3.42 points on average. That's a small sample, and 45-57 isn't statistically significant on its own. But it points in the opposite direction from the "starter is back" pitch. If anything, the market may give these teams a little too much credit.
The pattern got stronger when we limited it to established starters. Quarterbacks who had made four or more starts that season before the injury and then missed four or more games went 20-30-2 ATS (40.00 percent) in their return game. That's only 52 games, so treat it as a lean, not a rule. Still, it's the opposite of what most bettors expect.
What Happens in the Games After the Return?
Here's the follow-up.
| Absence length | Return game | Next game | Second game after |
|---|---|---|---|
| 1 game | 50.36% | 44.00% (55-70-5) | 47.90% |
| 2-3 games | 52.42% | 50.00% (57-57-2) | 53.40% |
| 4+ games | 44.12% | 51.69% (46-43-4) | 40.70% (35-51-1) |
| All returns | 49.32% | 48.17% | 47.73% |
Nothing here beats the baseline. The one-game group dropped to 44.00 percent in the following game, and the long-absence group fell to 40.70 percent two games later. Both are small samples, and they don't point the same way, so we wouldn't build a system on either. The broad takeaway is simple: in the three-game window after a starter returns, teams covered less than half the time.
Does It Matter if the Team Is Favored?
A little.
| Returning team | ATS record | Cover rate |
|---|---|---|
| Favorite | 67-76-5 | 46.85% |
| Underdog | 112-108-7 | 50.91% |
| Home | 94-95-9 | 49.74% |
| Away | 86-90-3 | 48.86% |
Returning teams that were laying points covered 46.85 percent of the time. That fits the story above. When the market makes a team with a returning quarterback the favorite, it has already priced in the starter, and bettors who pile on the "he's back" angle are paying full price for it. Home and away made no difference.
The total isn't a tell either. Return games went over 193-179-5, or 51.88 percent. That's close enough to even that it doesn't tell you anything.
What About Late-Season Returns Like Lamar Jackson's?
Jackson's likely return would come in December. Here's how late-season returns did:
| Return timing | Returns | ATS record | Cover rate |
|---|---|---|---|
| Week 12 or later, any absence | 188 | 90-91-7 | 49.72% |
| Week 12 or later, 4+ games missed | 64 | 26-35-3 | 42.62% |
Late returns after short absences were fine. Late returns after long absences went 26-35-3. That fits a quarterback who has been out for a month or more, gets back for a stretch run, and needs time to look like himself. Again, 64 games is a small sample.
Did the Backup Games Show Anything?
The games during the absence are part of this story too. Across those absences, teams playing without their Week 1 starter went 511-585 ATS, a 46.62 percent cover rate. The market was a little slow to mark down teams starting a backup, and then priced the return about right. That's consistent with what we found in the Lamar Jackson thumb line swing and earlier in the Lamar Jackson ankle line swing: the big move happens when the starter goes down, not when he comes back.
Is It Different by Era?
| Seasons | Returns | ATS record | Cover rate |
|---|---|---|---|
| 1999-2008 | 149 | 67-78-4 | 46.21% |
| 2009-2017 | 113 | 58-52-3 | 52.73% |
| 2018-2025 | 115 | 55-55-5 | 50.00% |
There's no steady trend. The most recent eight seasons are exactly even, 55-55-5. Whatever edge existed in the 2000s, the current market has priced it out.
How Have Returning Quarterbacks Done in 2026?
Seven Week 1 starters have returned to the lineup this season. They've gone 4-3 against the spread.
| Team | Week | Quarterback | Starts missed | Closing line | Final margin | ATS |
|---|---|---|---|---|---|---|
| MIN | 3 | Kyler Murray | 1 | -1.5 | +7 | Cover |
| WAS | 5 | Jayden Daniels | 1 | -3.5 | 0 (tie) | No cover |
| CHI | 6 | Caleb Williams | 3 | -1.5 | +8 | Cover |
| PHI | 7 | Jalen Hurts | 1 | +4.5 | -17 | No cover |
| SEA | 7 | Sam Darnold | 5 | -3 | +17 | Cover |
| TB | 7 | Baker Mayfield | 3 | +3 | +30 | Cover |
| BAL | 8 | Lamar Jackson | 3 | +3 | -26 | No cover |
Baltimore's game is the best example of the risk. Jackson returned against the Bills after missing three starts, and his game ended after one snap with the thumb injury that later required surgery. A pregame bet on "the starter is back" was in trouble before the first drive was over.
How to Tell When a Service Is Selling the "QB Is Back" Narrative
This is the practical part. Any pick service can tell you a starter is returning. The test is what it does with that information.
1. It treats the return as the edge. The line already moved. Over 377 returns, teams covered 49.32 percent of the time. If the only reason given for a pick is "the starter is back," that's a story, not a number.
2. It ignores how long he was out. A one-game absence and a six-game absence aren't the same spot. Long absences produced a 44.12 percent cover rate. A serious service should know that.
3. It lays big numbers on a returning favorite. Returning favorites covered 46.85 percent of the time. The market is charging full price.
4. It never mentions the first drive. The most useful information about a returning quarterback shows up after kickoff: how he moves in the pocket, whether he's throwing downfield, and whether the play-calling protects him.
That last point is why we bet the way we do. Pregame, you're guessing how healthy he is. Live, you can watch. A quarterback who's clearly limited on the first two series and a quarterback who looks like himself call for very different bets, and the live line often takes a few drives to sort them out.
If you're comparing sports handicapping service options, ask whether its NFL card includes live betting picks or only a pregame list. Our weekly NFL picks against the spread and football betting picks pages show the full card. For other quarterback angles we've tested, see rookie quarterbacks against the spread, older quarterbacks against the spread and elite quarterbacks as underdogs. The same rule applies to the NBA, where our basketball handicappers treat a star's first game back as something to watch live, not to bet blind.
What This Study Doesn't Cover
This study uses regular-season games from 1999 through 2025, plus the 2026 games played so far. The "starter" is the team's Week 1 quarterback, so mid-season starting changes and trades aren't treated as returns. The data doesn't tell us why a quarterback missed games, so a few benchings and rest days are mixed in with injuries. We used closing spreads, so the cover rates reflect the market's final price, not the opening line. Results by absence length and by timing come from small samples and aren't statistically significant on their own.
Get Tonight's Live Picks
Want live in-game NFL calls, including the first drives of a quarterback's return game, sent to your phone during the game?
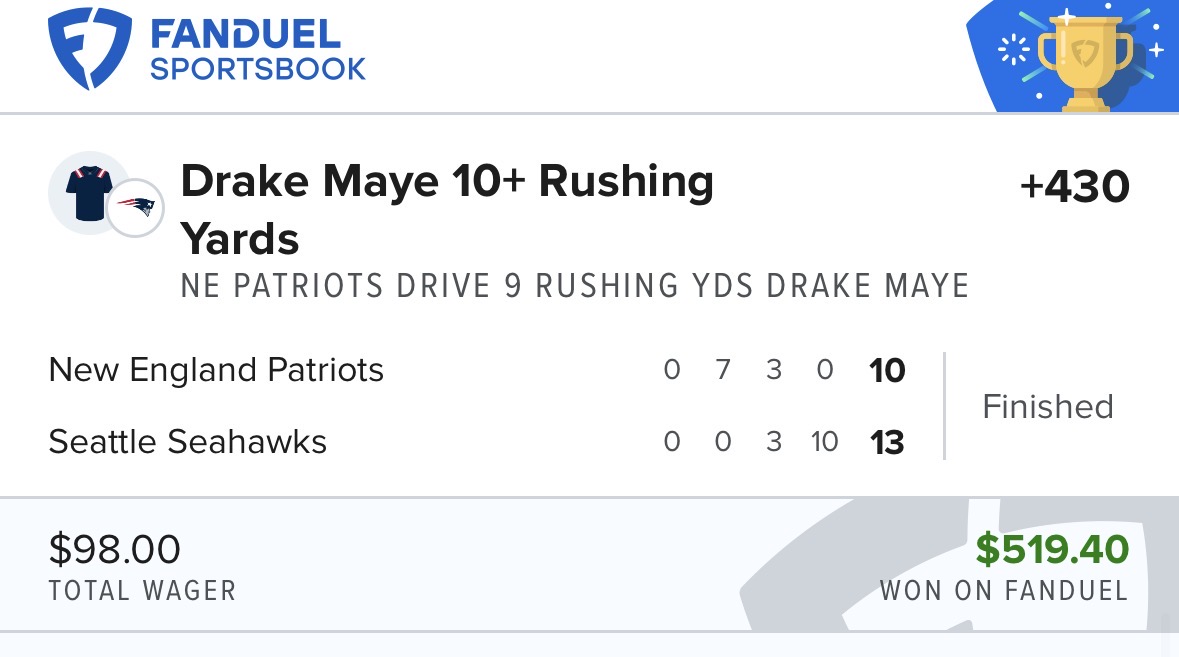
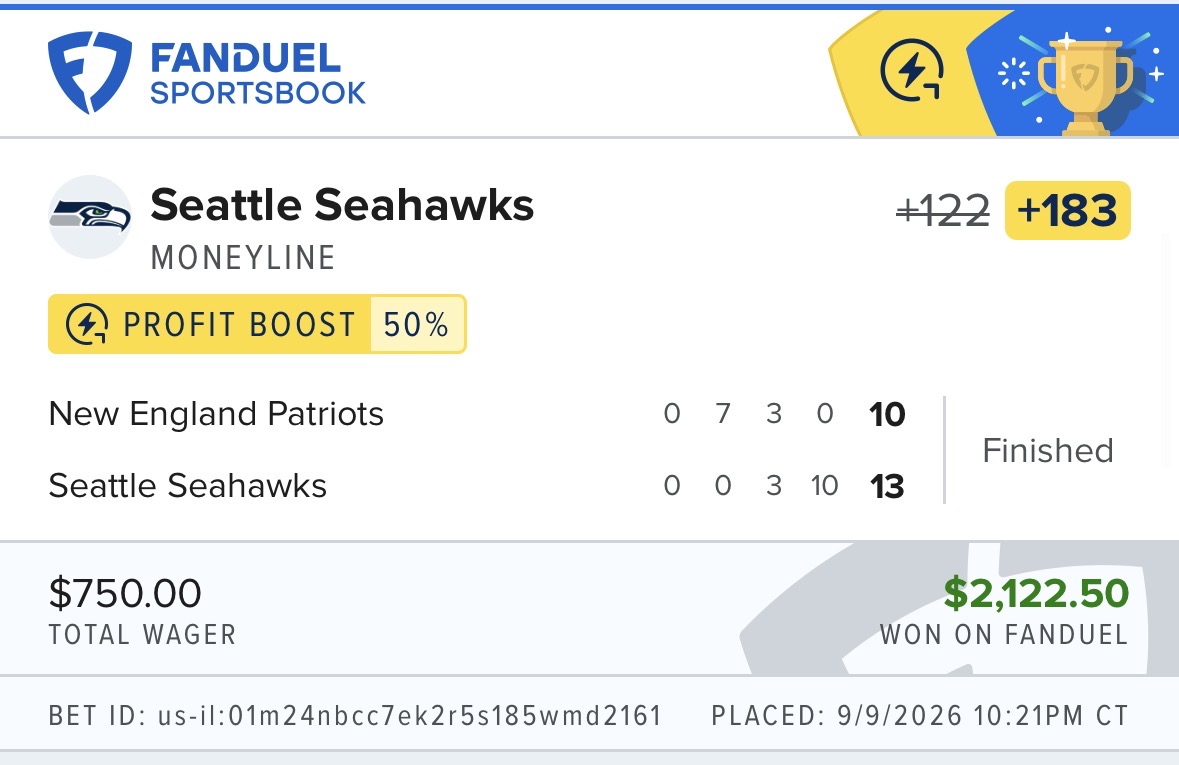
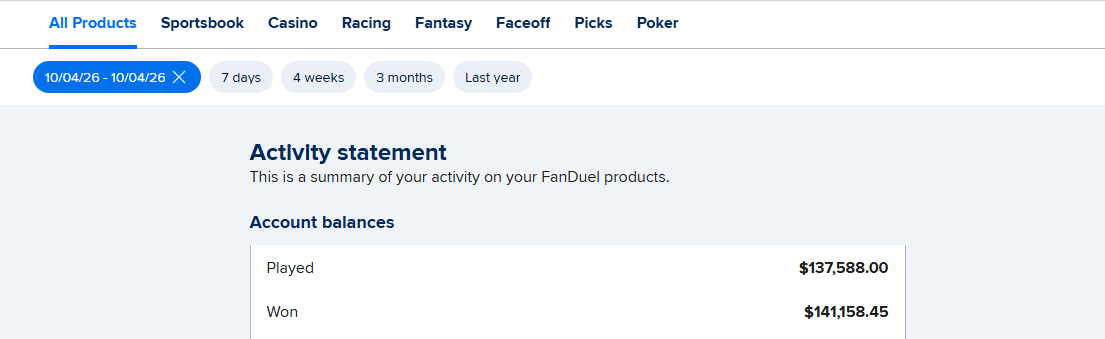
The Best Bet on Sports is the only live betting handicapping service limited on all six major U.S. sportsbooks (FanDuel, DraftKings, Caesars, BetMGM, Fanatics, ESPN BET) for winning too much during in-game action. Verified profit: $367,520+. Live calls go out through Email and Discord during games, and every bet in the $10,000 to $100,000 challenge is posted as it happens.
→ Join The Best Bet on Sports community — newsletter, live stream and Discord → Try a free live pick first — reserve your spot for tonight's pick
Frequently Asked Questions
Do NFL teams cover the spread when their starting quarterback returns from injury?
Not more than usual. From 1999 through 2025, teams whose Week 1 starter returned after missing one or more starts went 180-185-12 against the spread, a 49.32 percent cover rate across 377 returns. That matches the 50.00 percent baseline for all NFL team-games. The line adjusts for the return, so the return alone isn't an edge.
Does a longer absence change how a returning quarterback's team covers?
It leaned the wrong way. Teams whose starter came back after missing four or more games went 45-57-4 ATS (44.12 percent) and won only 38.68 percent of those games straight up. Starters who had made four or more starts before missing four or more games went 20-30-2 ATS. Both samples are small and not statistically significant.
How do teams do against the spread in the games after a quarterback returns?
Slightly below average. Across all returns, teams covered 48.17 percent of the time in the next game and 47.73 percent in the second game after. Teams whose quarterback had missed only one game covered 44.00 percent of the time the following week.
Are returning quarterback teams good bets as favorites?
History says no. Returning teams that were favored went 67-76-5 ATS, a 46.85 percent cover rate. Returning underdogs went 112-108-7 (50.91 percent). When the market already has a team favored with its starter back, the return is fully priced.
How did teams do while their starting quarterback was out?
Teams playing without their Week 1 starter went 511-585 against the spread during those absences, a 46.62 percent cover rate. The market was slightly slow to mark those teams down, then priced the starter's return about right.
When is Lamar Jackson expected to return for the Ravens?
Ravens coach Jesse Minter said injuries like Jackson's broken and dislocated thumb typically take about 6-10 weeks to heal, Pro Football Rumors reported on November 13, and Jackson plans to return late in the season. In our study, late-season returns after four or more missed games went 26-35-3 against the spread.
Should you bet a team the week its quarterback comes back?
Not on the return alone. Teams covered 49.32 percent of the time in return games, and long absences did worse. The more useful information comes after kickoff, when you can see how the quarterback moves and how the offense is calling plays. That's why we treat return games as live-betting spots.
The Best Bet on Sports · 1.5M followers on TikTok
Sports Betting TikTok is the live betting account behind The Best Bet on Sports, covering NFL, NCAAF, NBA, NCAAB, MLB and WNBA markets in real time. The account has been limited on all six major U.S. sportsbooks — FanDuel, DraftKings, Caesars, BetMGM, Fanatics and ESPN BET — for winning on live betting, with $367,520 in verified profit since 2005. View full profile →
Past results do not guarantee future performance. Must be 21 or older to wager.
Related Articles
Fade the Second Road Game? ATS Test
Buy Teams After a Turnover Disaster? ATS Tested
Should You Fade Rookie QBs Against the Spread? Tested
Moneyline or Spread on NFL Favorites? 11 Years Tested
NFL Look-Ahead Spots, Tested
Older NFL QBs Against the Spread, Tested
Get real live betting picks
From $39.95/mo · Cancel anytime · Email + Discord delivery
● Get The Picks
Choose your package
Tap any tier below to select · Subscribe in one tap
👇 Tap any package to select it
✓ You're selecting
25 Units · $99.95/month
25 unit picks per month. Sweet spot for most bettors — plenty of action without going all-in.
- ✓25 live betting selections/month
- ✓Email + Discord delivery
- ✓All sports (NFL, NCAAF, NBA, NCAAB, MLB)
- ✓Mix of 1, 2, 3, 5-unit rated plays
- ✓Cancel anytime
Secure PayPal · Cancel anytime · No hidden fees · 21+ · +$367K verified
+$367,520 verified · Limited on 6 sportsbooks · 20 years documented · See Proof
Join Our Newsletter
Get free expert sports picks and analysis delivered weekly.