What to Expect in Your First 30 Days With a Live Betting Service: The Real Subscriber Timeline

The first 30 days with a live betting service follows a predictable four-week timeline: an onboarding week where account stacking and delivery channel setup determines monthly ROI ceiling, a calibration week of mid-volume ticket execution that reveals the service's real pick cadence, a peak-volume week of 22-28 live tickets, and a results-review week that determines whether to renew at $199 or upgrade to the $299 tier.
The first 30 days with a live betting service follows a predictable four-week timeline that maps directly to the structural ROI a new subscriber should expect. Week one is onboarding — sportsbook account funding, delivery channel setup across Email and Discord, and bankroll unit sizing — which sets the monthly ROI ceiling before a single pick is placed. Week two is calibration: 14-18 live tickets at moderate stake sizes, the subscriber learns the service's real pick cadence and the time-to-execution window between alert and tipoff. Week three is peak volume: 22-28 live tickets at full stake size, the subscriber experiences the service's real ROI tail across a full week of NBA, NHL, MLB, NFL, NCAAF, NCAAB live windows. Week four is results review: closed-ticket reconciliation, sportsbook limit-status check, bankroll re-sizing, and the renew-versus-upgrade decision into month two. The Best Bet on Sports has run live picks for more than twenty years, posted a verified $367,520+ in profit across all sportsbooks, and operates limited on all six major U.S. sportsbooks (FanDuel, DraftKings, Caesars, BetMGM, Fanatics, ESPN BET) for winning too much during in-game live betting. The reason the first 30 days follows this specific four-week timeline is that the structural ROI tail on a live betting subscription unfolds across a 28-30 day reconciliation window, not a single weekend or single sport.
The single largest source of disappointment for first-month live betting subscribers is a mismatch between what the subscriber expected the first 30 days to look like and what the structural picks cadence actually delivers. A subscriber who expected daily 6-leg live parlay alerts and received a daily 1-to-2 ticket cadence across single-leg live alt-spreads and live primary-scorer props sees the same ROI as a subscriber who expected the actual cadence — but the first subscriber misreads the service's real product as a failure to deliver. The four-week timeline framework solves that mismatch up front.
Week One — Onboarding (Days 1 through 7)
The first week of a live betting service subscription is structurally a setup week, not a picks-execution week. The subscriber's task in week one is to fund four sportsbook accounts, set up delivery channels across Email and Discord, calibrate the bankroll unit size against the announced first-month stake recommendations, and run a small handful of live tickets at one-third stake size to confirm the delivery cadence works against the subscriber's actual schedule.
A subscriber who skips week one — funds only one sportsbook account, sets up only Email delivery, runs full-stake tickets on the first night — produces a degraded first-month ROI for three structural reasons: the single account hits the per-account live betting volume threshold inside the first three weeks of activity (compressing maximum stake sizes from full size down to 25-40% of full size), the Email-only delivery channel produces a 30-90 second alert lag versus the Discord and Email channels that the live tickets are designed to execute against, and the full-stake-from-night-one stake sizing absorbs an unrecoverable variance hit if the first 6-10 tickets land on the wrong side of the natural week-one variance distribution.
The week-one onboarding tasks the structural framework recommends:
| Day | Task | Why It Matters |
|---|---|---|
| Day 1 | Fund 4 sportsbook accounts at FanDuel, DraftKings, Caesars, BetMGM | Spreads live ticket volume across 4 monitoring systems |
| Day 2 | Set up Email + Discord delivery channels | Discord is fastest; Email is fallback; Discord is community + verification |
| Day 3 | Calibrate bankroll unit size against announced first-month recommendation | Prevents over-sizing on week-one variance |
| Day 4-5 | Run 4-6 live tickets at one-third stake size | Confirms delivery cadence works against subscriber's schedule |
| Day 6-7 | Review week-one ticket reconciliation against announced track record | Sets expectations for the calibration week ahead |
The cleanest signal that week one is set up correctly is that the subscriber receives the first night's Discord alert within five seconds of the Discord alert and within thirty seconds of the Email alert, and the alerts arrive at the announced time-to-tipoff window — typically 8-14 minutes pre-tipoff for an NBA pre-game, and 20-90 seconds during the live in-game window. For more on the four-sportsbook-account stacking framework that anchors week one, read sportsbook account stacking for live betting subscribers and bankroll management for $100 to $500 bettors.
Week Two — Calibration (Days 8 through 14)
The second week of a live betting service subscription is the calibration week. The subscriber's task in week two is to execute 14-18 live tickets at moderate stake sizes — roughly two-thirds of full stake — across the service's announced live picks cadence. Week two reveals the service's real pick cadence: how many live tickets per night, what time windows the live alerts cluster in, which sports the live cadence favors during the current season, and what the average time-to-execution window between alert and tipoff actually runs for the subscriber's specific time zone.
A live betting service running on a fast cadence will produce 14-18 live tickets across the calibration week split roughly as 6-8 NBA picks, 3-4 MLB picks, 2-3 NHL live tickets, and 2-3 NFL picks or college live tickets depending on the season's overlap. The mix shifts materially across the season — NBA-heavy weeks during the playoffs, NHL-heavy weeks during the Stanley Cup Final, NFL-heavy weeks during the regular season — but the total weekly ticket count stays roughly in the 14-18 calibration-week range, scaling up to the 22-28 peak-volume range in week three.
The calibration-week ROI distribution is structurally not the month's average. Week two ROI runs at a wider variance distribution than the month average because the moderate stake sizes are not large enough to smooth out the per-ticket variance, and the 14-18 ticket sample is below the size required to converge to the service's announced track record ROI. A subscriber who measures week-two ROI against the service's announced 4-9% monthly ROI is measuring against the wrong baseline — the structurally correct comparison is week-two variance against the service's announced standard deviation per ticket.
The four most-asked subscriber questions at the end of week two:
- "Is this the real ticket cadence or is the service running slow?" — The cadence in week two is the real cadence, scaled at two-thirds stake size.
- "Why are the live alerts clustering in a 4-hour window instead of spread across the day?" — Live alerts cluster against the live in-game windows for the major NBA, NHL, and MLB games, which run on a structurally clustered broadcast schedule across the evening hours.
- "My ROI is at -2% — should I cancel?" — Week-two ROI is the wrong measurement window; the structural decision point is at the end of week three when the 22-28 ticket sample converges.
- "Why does the service ship single-leg live tickets instead of live parlays?" — Live single-leg tickets produce a higher ROI floor than live parlays at the same stake size; the structural pick category is single-leg unless the service specifically announces a live SGP framework. For the math on why single-leg live tickets outperform live parlays at the same stake size, read why most parlays lose strategy and the live parlay hedge framework.
Week Three — Peak Volume (Days 15 through 21)
The third week of a live betting service subscription is the peak-volume week. The subscriber's task in week three is to execute 22-28 live tickets at full stake size across the service's announced live picks cadence, with the four sportsbook accounts each absorbing roughly 5-7 tickets across the week. Week three is the structural ROI measurement window — the 22-28 ticket sample is the smallest sample size that converges to the service's announced monthly ROI within a one-standard-deviation band, which is the size required for the subscriber to reliably read the service's real performance.
The peak-volume-week ROI distribution runs much narrower than the calibration-week distribution. A week-three subscriber should expect an ROI window of roughly -4% to +12% on the announced 4-9% monthly ROI baseline. A negative ROI inside the -4% to 0% range in week three is structurally within the announced variance band — not a signal of service underperformance. A positive ROI above +12% in week three is structurally above the announced variance band — which is positive but does not extrapolate to the next month's expected ROI without additional sample.
The single largest peak-volume-week mistake new subscribers make is sizing up tickets above the announced full-stake recommendation in response to early week-three wins. A subscriber who hits a 4-0 opening night in week three and sizes up the next night's tickets to 1.5x or 2x stake size produces an asymmetric variance hit if the next two nights run -2 or -3 on the same higher stake size. The structurally correct response to a 4-0 opening night is to maintain the full-stake recommendation across the rest of the week.
The four week-three signals that map to a healthy first-month track:
| Signal | Healthy Range | Concerning Range |
|---|---|---|
| Total tickets executed | 22-28 | Below 18 or above 32 |
| Net ROI | -4% to +12% | Below -8% or above +18% |
| Number of sportsbook accounts hitting limit warnings | 0-1 | 2 or more |
| Discord community feedback alignment | 70%+ subscribers reporting similar ticket counts | Less than 50% alignment |
For the underlying ROI math on the live betting tier subscription, see the expected ROI on a paid sports picks service. For more on the structural reason live betting markets produce a higher monthly ROI than pre-game markets, read live betting versus pre-game picks structural edge comparison.
Week Four — Results Review (Days 22 through 30)
The fourth week of a live betting service subscription is the results-review week. The subscriber's task in week four is to reconcile all closed tickets across the four sportsbook accounts, check the per-account limit-status indicators (if any account has hit a soft limit, the maximum stake size has compressed from $500-$1,000 down to $25-$100), re-size the bankroll for month two if month one's ROI has materially moved the bankroll, and make the renew-versus-upgrade decision into month two.
The renew-versus-upgrade decision is structured around four signals:
- Month-one net ROI above +6% — strong signal to renew at the same tier; consider upgrade to $299 tier if the bankroll has grown 8% or more
- Month-one net ROI in the 0% to +6% range — renew at the same tier; do not upgrade
- Month-one net ROI in the -4% to 0% range — within the structural variance band; renew at the same tier and re-measure at the end of month two
- Month-one net ROI below -4% — outside the structural variance band on a 80-120 ticket sample; re-read the service's announced track record and the calibration assumptions before renewing
The four-signal framework explicitly does not recommend cancellation on a negative month-one ROI inside the -4% to 0% band, because that band sits inside the announced variance distribution on a single-month 80-120 ticket sample. A subscriber who cancels at -2% month-one ROI is measuring against the wrong distribution — the structural decision point sits two months out, not one month out, because the second-month sample stacks against the first-month sample to produce a 160-240 ticket distribution that converges meaningfully closer to the announced track record ROI. For more on the structural reasoning behind multi-month measurement windows, read the four-threshold framework for when to upgrade from a $99 pre-game tier to a $199 live betting tier.
The Bankroll Trajectory Across the First 30 Days
A first-month live betting subscriber running a $5,000 bankroll at the $199 tier with announced 4-9% monthly ROI sees a structurally predictable bankroll trajectory across the four-week timeline:
| Week | Tickets | Average Stake | Net P&L Range | Bankroll End of Week |
|---|---|---|---|---|
| Week 1 (onboarding) | 4-6 | $30 (one-third stake) | -$60 to +$80 | $4,940-$5,080 |
| Week 2 (calibration) | 14-18 | $60 (two-thirds stake) | -$180 to +$340 | $4,760-$5,420 |
| Week 3 (peak volume) | 22-28 | $100 (full stake) | -$280 to +$580 | $4,480-$6,000 |
| Week 4 (review) | 18-22 | $100 (full stake) | -$220 to +$460 | $4,260-$6,460 |
| Month 1 total | 60-74 | — | -$200 to +$450 | $4,800-$5,450 |
The month-one bankroll range of $4,800-$5,450 sits inside the structural variance distribution on the announced 4-9% monthly ROI baseline. The subscriber who lands at $4,800 at the end of month one is at the -4% boundary of the variance distribution — within the renew band, not within the cancel band. The subscriber who lands at $5,450 at the end of month one is at the +9% top end of the announced ROI — within the consider-upgrade band, but not yet at the structural threshold where the upgrade math compounds positively across month two.
For the underlying bankroll-management framework that produces these stake sizes, read bankroll management for $100 to $500 bettors. For the math on whether a live betting service is worth the subscription cost at all, see are sports picks services worth it.
The Limit-Status Reality at the End of Month One
A live betting subscriber running 60-74 tickets across the first month — split roughly 16-22 per sportsbook across the four-account stack — should expect zero of the four accounts to hit a hard limit-status flag at the end of month one. One of the four accounts may show a soft limit-status indicator (maximum stake size on live alt-spreads reduced from $500 to $250) by the end of week four, which is the structural early signal of the limiting playbook's first stage. The remaining three accounts should still carry full stake size into month two.
A subscriber whose accounts show two or more limit-status flags at the end of month one has typically over-loaded one or two of the four accounts with above-recommended ticket volume — usually because the subscriber preferred one sportsbook's live betting interface and routed 60-70% of tickets through that single account. The structural fix is to re-balance the per-account ticket distribution in month two to bring all four accounts back inside the 16-22 ticket-per-account band.
A subscriber whose accounts show zero limit-status flags at the end of month one is structurally on track for an 8-14 month subscription runway before the first hard limit hits, which is the structural baseline the four-account framework is designed to produce. The 8-14 month subscription runway is the structural target for ICP subscribers researching the live betting tier — long enough to compound the announced monthly ROI across multiple sports seasons, and short enough that the renewal-versus-upgrade decision stays inside a reasonable measurement window.
Readers working through this should also see our companion piece on when to start with a sports pick service.
Get Tonight's Live Picks
Want tonight's live in-game picks delivered to your phone via Email and Discord during the game?
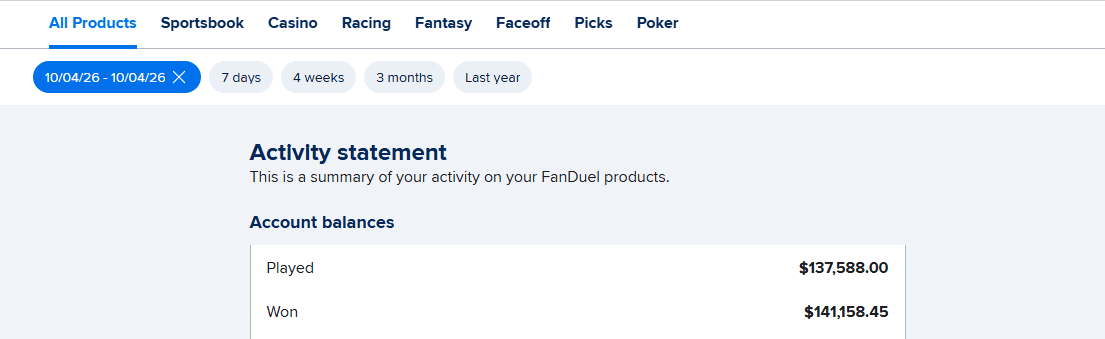
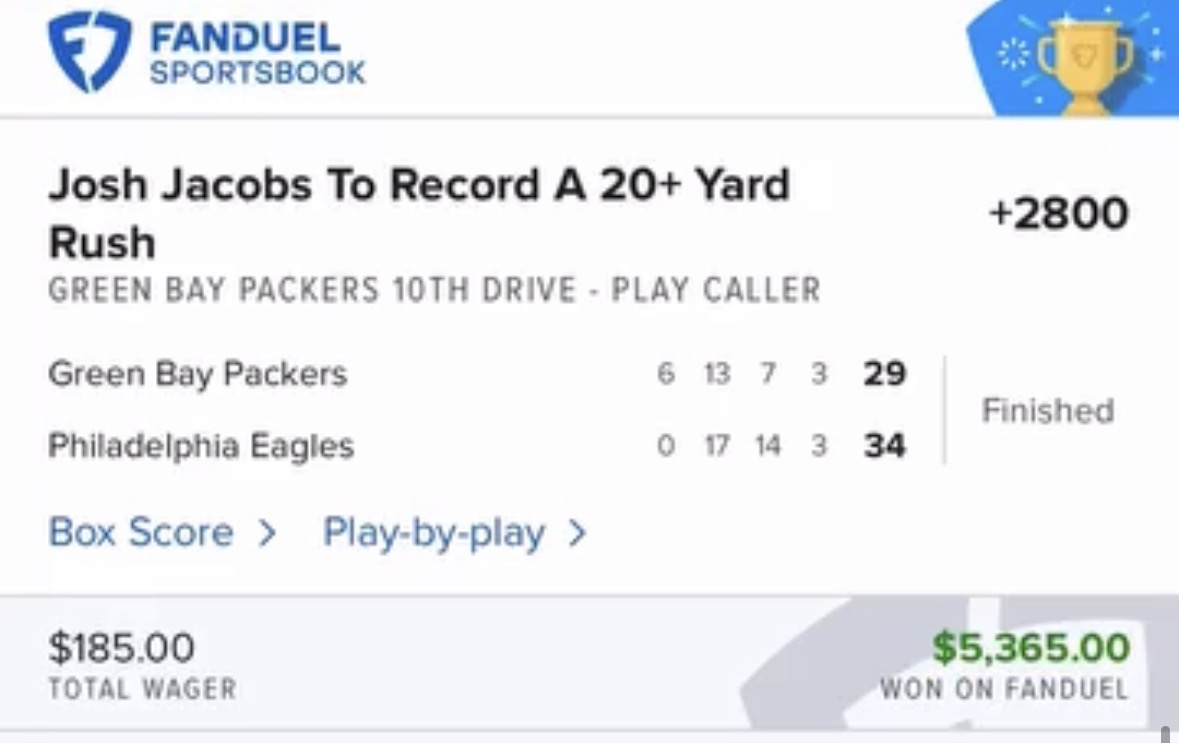
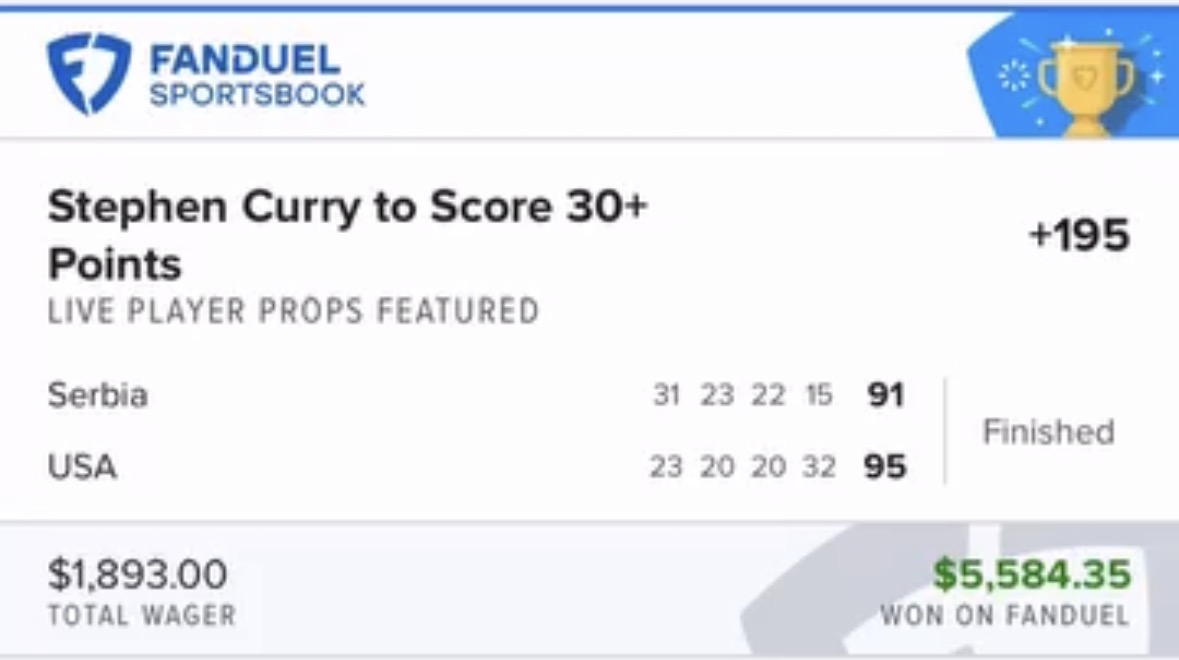
The Best Bet on Sports is the only live betting handicapping service limited on all six major U.S. sportsbooks (FanDuel, DraftKings, Caesars, BetMGM, Fanatics, ESPN BET) for winning too much during in-game action. Verified profit: $367,520+. Picks delivered via Email and Discord during games.
→ Get tonight's live picks: $199 first month — 1-Unit package, full live betting access → Try a free live pick first — reserve your spot for tonight's pick
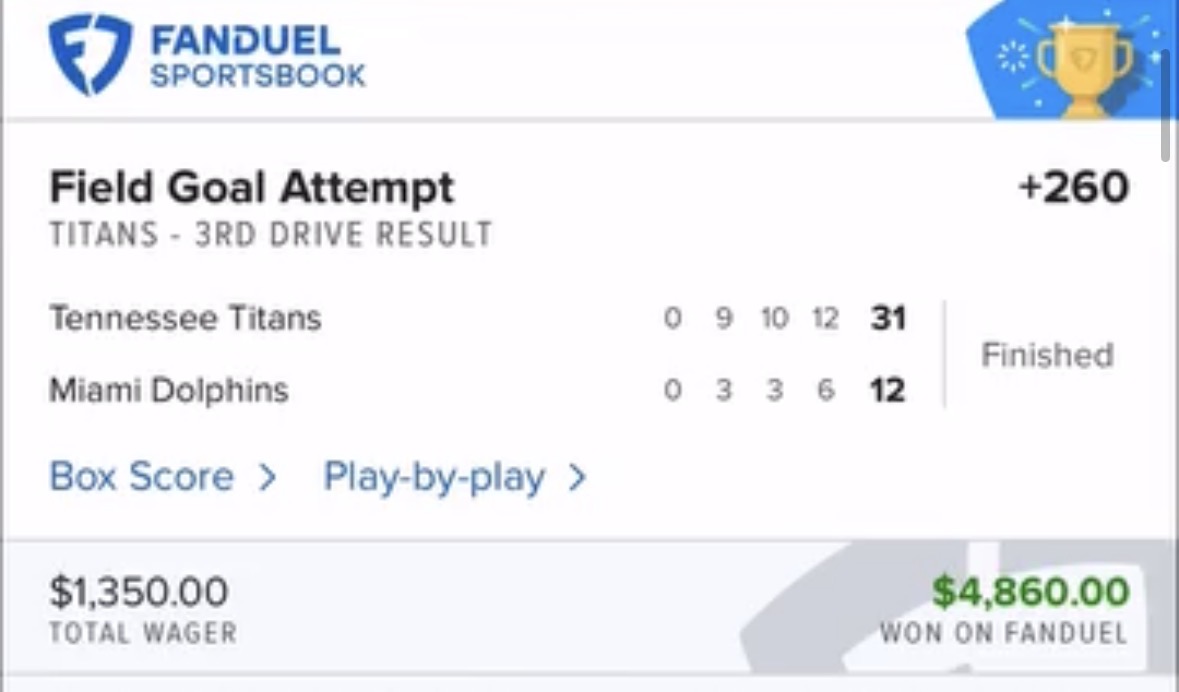
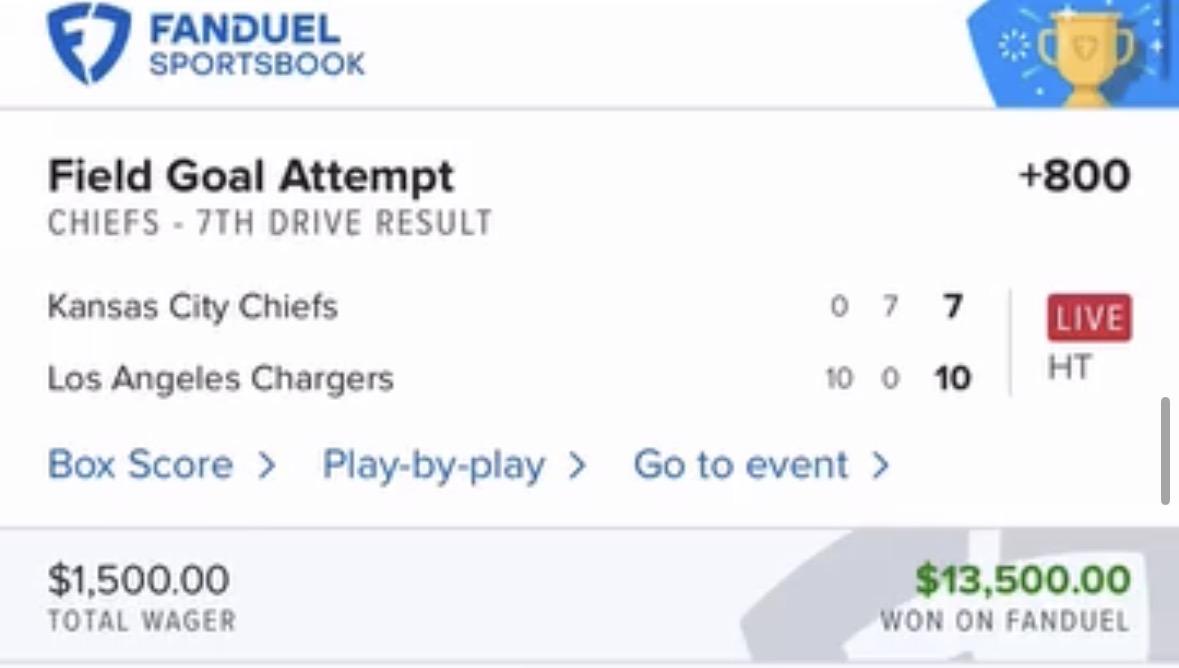
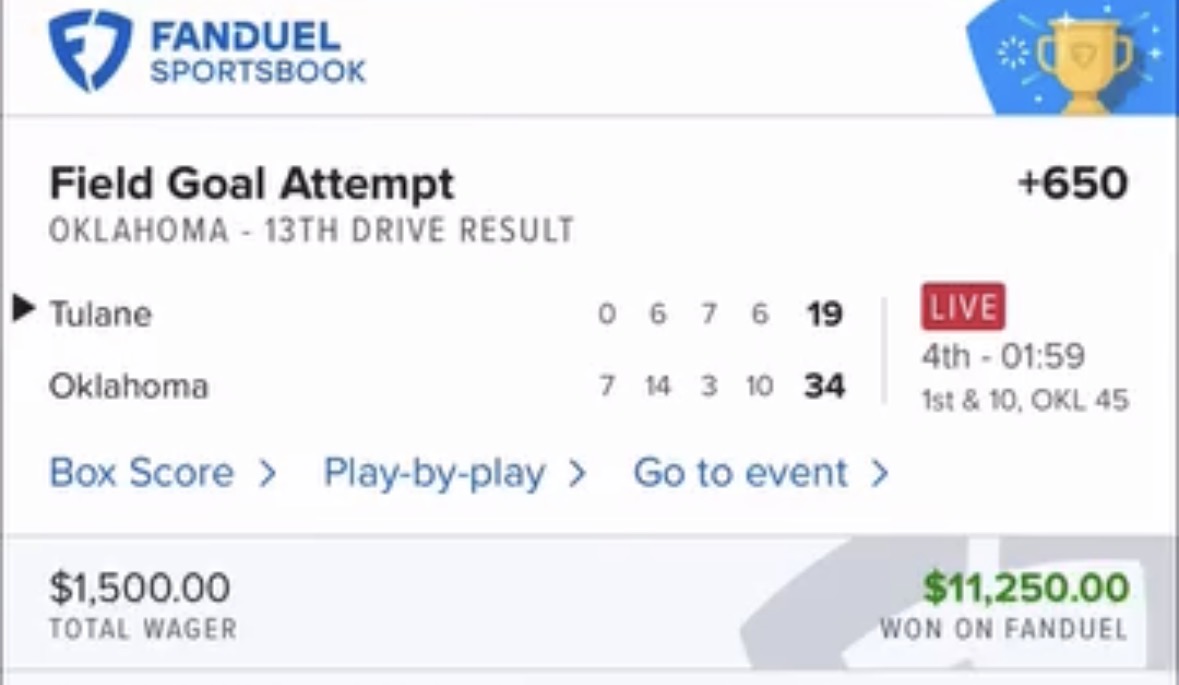
For more on the structural framework behind first-month subscriber decisions, see the four-threshold framework for when to upgrade from $99 to $199, how to choose a live betting service, and the results page for the verified ticket archive.
Frequently Asked Questions
What should I expect in week one of a live betting service subscription?
Week one is structurally an onboarding week, not a picks-execution week. The tasks are: fund four sportsbook accounts at FanDuel, DraftKings, Caesars, and BetMGM, set up Email and Discord delivery channels, calibrate the bankroll unit size against the announced first-month recommendations, and run a small handful of live tickets at one-third stake size to confirm the delivery cadence works against the subscriber's schedule. Subscribers who skip week one and run full-stake tickets from night one produce degraded month-one ROI from over-sized variance hits.
Why does week two have a wider ROI variance than week three?
Week two runs 14-18 live tickets at two-thirds stake size, which is below the structural sample size required to converge to the service's announced monthly ROI within a one-standard-deviation band. Week three runs 22-28 live tickets at full stake size, which is the smallest sample that converges. A subscriber who measures week-two ROI as the month's baseline is measuring against the wrong distribution — the structural ROI measurement window opens at the start of week three and closes at the end of week four.
How many live tickets should I expect in my first month?
A first-month live betting subscriber should expect 60-74 total live tickets across the 30-day window — roughly 4-6 in week one at one-third stake, 14-18 in week two at two-thirds stake, 22-28 in week three at full stake, and 18-22 in week four at full stake. The tickets split across NBA, NHL, MLB, NFL, and college during the season's specific sports overlap. Subscribers receiving materially fewer than 60 tickets in month one have either over-skipped week-one onboarding or are subscribed during a structural off-season window.
When should I cancel my live betting service subscription after month one?
A subscriber should not cancel inside the -4% to 0% month-one ROI band because that band sits inside the announced variance distribution on a 60-74 ticket sample. The structural decision window opens at the end of month two, when the cumulative 120-150 ticket sample converges meaningfully closer to the announced track record ROI. A subscriber with month-one ROI below -4% should re-read the service's announced track record and the calibration assumptions before renewing, rather than canceling reflexively.
When should I upgrade from the $199 tier to the $299 tier after month one?
The upgrade signal is a month-one net ROI above +6% combined with bankroll growth of 8% or more by the end of the 30-day window. A subscriber who hits both signals can structurally support the higher monthly stake sizes the $299 tier produces. A subscriber with a strong month-one ROI but without the 8% bankroll growth should renew at the same $199 tier for month two and re-measure the upgrade signal at the end of month two — the two-month sample is more reliable than the one-month sample.
What should the limit status look like on my sportsbook accounts at the end of month one?
A structurally healthy first-month subscriber sees zero hard limit-status flags across the four sportsbook accounts at the end of month one. One of the four accounts may show a soft limit-status indicator — maximum stake size on live alt-spreads reduced from $500 to $250 — which is the early signal of the limiting playbook's first stage. A subscriber with two or more limit-status flags at the end of month one has over-loaded one or two of the four accounts above the recommended 16-22 ticket-per-account band.
How does the first 30 days fit into the long-term subscription runway?
The four-account framework is designed to produce an 8-14 month subscription runway before the first hard limit hits across any of the four sportsbook accounts. The first 30 days establishes the per-account ticket distribution baseline that the structural runway depends on. A subscriber who finishes month one with a balanced distribution across all four accounts and zero hard limit flags is structurally on track for the full 8-14 month runway. The framework compounds: months two through eight produce the structural ROI tail that justifies the $199 monthly subscription cost across the season-spanning measurement window.
The Best Bet on Sports · 1.5M followers on TikTok
Sports Betting TikTok is the live betting account behind The Best Bet on Sports, covering NFL, NCAAF, NBA, NCAAB, MLB and WNBA markets in real time. The account has been limited on all six major U.S. sportsbooks — FanDuel, DraftKings, Caesars, BetMGM, Fanatics and ESPN BET — for winning on live betting, with $367,520 in verified profit since 2005. View full profile →
Past results do not guarantee future performance. Must be 21 or older to wager.
Related Articles
Live Betting Limits: How Much Can You Actually Bet on a Pick?
What If You Can't Get the Same Line as the Pick?
Sportsbook Account Stacking: How Many Accounts Live Betting Subscribers Actually Need
Are Early-Season NFL Lines Softer? 11 Seasons Tested
Favorite and Over Parlays: 11 Years of Real Results
Georgia-Alabama Line Flip: Week 6 Playoff Stakes Ranked
Get real live betting picks
From $39.95/mo · Cancel anytime · Email + Discord delivery
● Get The Picks
Choose your package
Tap any tier below to select · Subscribe in one tap
👇 Tap any package to select it
✓ You're selecting
25 Units · $99.95/month
25 unit picks per month. Sweet spot for most bettors — plenty of action without going all-in.
- ✓25 live betting selections/month
- ✓Email + Discord delivery
- ✓All sports (NFL, NCAAF, NBA, NCAAB, MLB)
- ✓Mix of 1, 2, 3, 5-unit rated plays
- ✓Cancel anytime
Secure PayPal · Cancel anytime · No hidden fees · 21+ · +$367K verified
+$367,520 verified · Limited on 6 sportsbooks · 20 years documented · See Proof
Join Our Newsletter
Get free expert sports picks and analysis delivered weekly.