NFL Total Turnovers Prop: How Often Over 2.5 Really Hits

An NFL regular-season game averages 2.62 total turnovers, based on 2,639 games from 2016 through 2025. Over 2.5 turnovers hit 49.34 percent of the time and over 3.5 hit 25.99 percent. The turnover count has almost no link to the game total, but a favorite that commits zero turnovers wins 84.64 percent of the time and covers 68.11 percent.
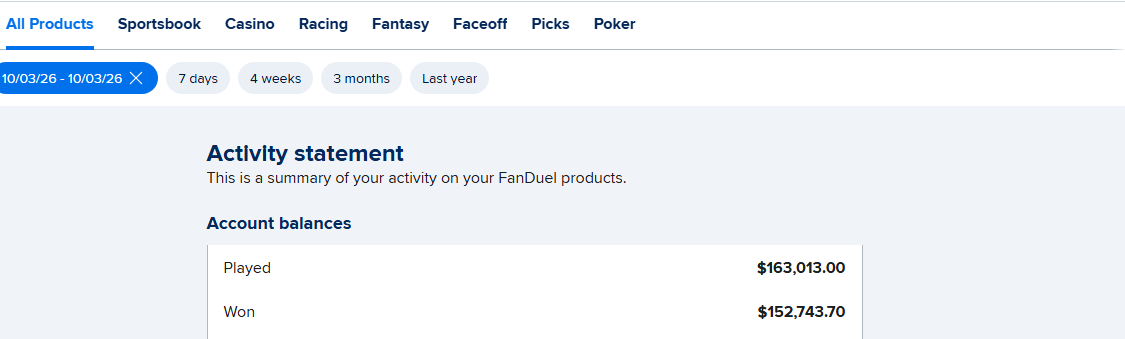
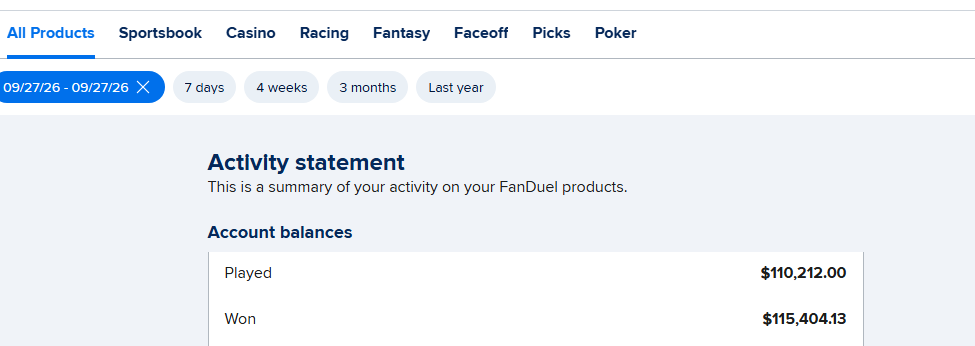
An NFL regular-season game averages 2.62 total turnovers, counting interceptions and lost fumbles, across 2,639 games from 2016 through 2025 in nflverse's play-by-play data. Over 2.5 turnovers hit 49.34 percent of the time, which is close to a coin flip, and over 3.5 hit 25.99 percent. The surprise for parlay builders is that the turnover count has almost nothing to do with the game total. The Best Bet on Sports has built a verified $367,520+ in profit across all sportsbooks over more than twenty years, and turnover spots are some of the live moments we bet most.
Total turnovers is one of the props that shows up in every same-game parlay builder. It feels like it should go with the under. Turnovers kill drives, so a sloppy game should be a low-scoring game. Or it should go with the over, because turnovers hand out short fields.
We checked both ideas against every regular-season game for ten seasons, plus the first ten weeks of 2026. Neither one holds up.
How Many Turnovers Are in an NFL Game?
Here's how often each turnover count showed up from 2016 through 2025:
| Total turnovers | Share of games |
|---|---|
| 0 | 6.59% |
| 1 | 19.14% |
| 2 | 24.93% |
| 3 | 23.34% |
| 4 | 14.10% |
| 5 | 7.24% |
| 6 or more | 4.66% |
The average is 2.62 and the median is 2. Two turnovers is the most common result, but three is right behind it, which is why 2.5 is the standard line.
Interceptions made up 59.72 percent of all turnovers. Lost fumbles made up the other 40.28 percent. At least one interception was thrown in 79.95 percent of games, and both teams threw one in 25.20 percent.
Through Week 10 of 2026, the average is 2.60 turnovers across 150 games, almost exactly the long-run number.
What Are the Fair Odds on Turnover Overs?
Here's each common line, with the fair American price based on how often it hit:
| Line | Over hit rate | Fair price | 2026 through Week 10 |
|---|---|---|---|
| Over 0.5 | 93.41% | -1417 | 91.33% |
| Over 1.5 | 74.27% | -289 | 74.67% |
| Over 2.5 | 49.34% | +103 | 48.67% |
| Over 3.5 | 25.99% | +285 | 28.67% |
| Over 4.5 | 11.90% | +740 | 11.33% |
The 2.5 line is a true coin flip, so a standard -110 on either side is close to a fair price minus the juice. The numbers further out are where you have to check the price. If a book is offering over 3.5 at +250, it's paying less than the fair +285.
Both teams committing at least one turnover hit 48.81 percent of the time, about +105. In 2026 it's running a little higher, at 52.67 percent.
Are Turnovers Going Down?
Yes, and that matters for the 2.5 line.
| Seasons | Avg turnovers | Over 2.5 | Any interception |
|---|---|---|---|
| 2016-2019 | 2.74 | 51.95% | 80.57% |
| 2020-2022 | 2.60 | 50.19% | 80.35% |
| 2023-2025 | 2.47 | 45.22% | 78.80% |
The 2025 season averaged 2.31 turnovers a game, the lowest of the ten seasons. From 2023 through 2025, the under 2.5 hit nearly 55 percent of the time. Playoff games are lower too, at 2.35 per game across 122 games.
2026 has bounced back a little, at 2.60. Ten weeks is a small sample, but if you're betting the under on old assumptions, know that the line hasn't always kept up with the trend.
Do Turnovers Go With the Over or the Under?
Neither. This is the most useful finding in the study.
| Turnover result | Games | Game went over |
|---|---|---|
| Over 2.5 turnovers | 1,291 | 48.02% |
| Under 2.5 turnovers | 1,327 | 49.89% |
| Zero turnovers | 171 | 46.78% |
The correlation between the turnover count and how far the game went over or under its total was 0.008. That's basically zero.
Here's what that means for a parlay. A turnover over 2.5 paired with the game under hit 25.63 percent of the time. If the two were completely unrelated, you'd expect 25.16 percent. Turnover over with the game over hit 23.68 percent, against 24.15 percent if unrelated.
So pairing a turnover prop with the game total isn't a correlated parlay in either direction. A turnover can end a scoring drive, which lowers the score. It can also hand the other team a short field or a defensive touchdown, which raises it. Over thousands of games, those two effects cancel out. We saw something similar with defensive and special teams touchdowns, which pushed the over harder than turnovers in general.
Does the total line help predict turnovers? Barely. Games with a total of 40.5 or lower averaged 2.65 turnovers, and games with totals of 47 to 49.5 averaged 2.65 too. The only group that stood out was totals of 50 or more, at 2.50 turnovers and a 44.74 percent over 2.5 rate. Good offenses in high-total games tend to hold onto the ball.
Where Is the Real Correlation?
On the side, not the total. This is where turnover props connect to the result.
| Favorite's turnovers | Games | Favorite won | Favorite covered |
|---|---|---|---|
| 0 | 853 | 84.64% | 68.11% |
| 1 | 879 | 69.97% | 51.99% |
| 2 | 499 | 50.10% | 32.06% |
| 3 or more | 339 | 28.61% | 16.81% |
Across all games, favorites won 66.38 percent of the time and covered 48.83 percent. A favorite that didn't turn it over won 84.64 percent and covered 68.11 percent. A favorite that turned it over twice was a coin flip to win at all.
Favorites went without a turnover in 32.94 percent of games. If that and the favorite winning were unrelated, both would happen together 21.86 percent of the time. They actually happened together 27.97 percent of the time. That's a strong positive correlation, and it's why many books either block "team under 0.5 turnovers" with that team's moneyline or price the pair well below the full parlay payout.
Underdogs show the same pattern, louder. In the 645 games where the underdog committed zero turnovers, the underdog covered 75.97 percent and won outright 58.17 percent. Overall, underdogs won 33.24 percent.
Two warnings. First, the turnover count is known only after the game. A table like this one shows how much turnovers swing results, not which team will avoid them. Second, favorites commit fewer turnovers on average, 1.18 per game against 1.44 for underdogs, and the gap widens with the spread. With a spread of 10 or more, favorites averaged 1.05 and underdogs 1.55. The market already knows better teams protect the ball.
Through Week 10 of 2026, favorites with zero turnovers are 33-8 straight up.
How Should You Use Turnover Props in a Parlay?
Three rules come out of the data:
1. Don't treat turnovers as a scoring signal. A "sloppy game, so take the under" parlay is two separate bets, not one connected read. Price each leg on its own. 2. Team turnover props belong with that team's side. If you think a favorite will protect the ball, that's really a bet that the favorite plays well. The correlation is real, which is why books limit it. 3. Watch the trend. Turnovers fell three seasons in a row before 2026. A book still pricing 2.5 at even money on both sides was slightly off in 2023 through 2025.
For parlay structure in general, our NFL team total parlay results show how stacking related legs changes the payout, and our total touchdowns prop study covers the scoring side of the same games.
Why Are Turnovers Better Bet Live?
Because the first half tells you a lot.
| First-half turnovers | Games | Full game over 2.5 | Avg full-game turnovers |
|---|---|---|---|
| 0 | 780 | 16.28% | 1.42 |
| 1 | 967 | 42.92% | 2.41 |
| 2 | 581 | 77.28% | 3.43 |
| 3 or more | 311 | 100% | 4.74 |
First halves held 45.82 percent of all turnovers. A clean first half drops the chance of over 2.5 to about one in six. Two first-half turnovers push it above three in four.
Live markets catch the count. They're slower on the reasons behind it. A tipped interception and a quarterback forcing throws into coverage both count as one turnover, but they don't mean the same thing for the second half. A team trailing by 14 and throwing every down is going to give the other side more chances, and that's where the live number can lag. We break down how the spread reacts in the moments right after a takeaway in our guide to live betting turnovers, and we tested whether to buy teams after a turnover disaster the following week.
We've been limited on all six major U.S. sportsbooks (FanDuel, DraftKings, Caesars, BetMGM, Fanatics and ESPN BET) for winning too much at live betting. If you want the weekly card, our NFL picks page has it, our football betting picks page explains how we approach a slate, and our NFL picks against the spread page covers the sides.
What This Study Doesn't Cover
This study counts interceptions and lost fumbles from nflverse play-by-play data for every regular-season game from 2016 through 2025, plus Weeks 1 through 10 of 2026 and 122 playoff games. Plays wiped out by penalties were removed. Some books grade turnover props differently, for example counting turnovers on downs or excluding overtime, so read the rules before you bet. Spreads and totals are the closing lines in the same data. Fair prices assume no juice.
Get Tonight's Live Picks
Want live in-game NFL calls, including the second-half spots where a team's game script makes the next turnover likely, sent to your phone during the game?
The Best Bet on Sports is the only live betting handicapping service limited on all six major U.S. sportsbooks (FanDuel, DraftKings, Caesars, BetMGM, Fanatics, ESPN BET) for winning too much during in-game action. Verified profit: $367,520+. Live calls go out through Email and Discord during games, and every bet in the $10,000 to $100,000 challenge is posted as it happens.
→ Join The Best Bet on Sports community — newsletter, live stream and Discord → Try a free live pick first — reserve your spot for tonight's pick
Frequently Asked Questions
How many turnovers are in an average NFL game?
An NFL regular-season game averaged 2.62 total turnovers from 2016 through 2025, counting interceptions and lost fumbles, across 2,639 games in nflverse play-by-play data. The median is 2. Through Week 10 of 2026, the average is 2.60.
How often does over 2.5 turnovers hit in the NFL?
Over 2.5 total turnovers hit 49.34 percent of the time from 2016 through 2025, a fair price of about +103. It fell to 45.22 percent from 2023 through 2025. Through Week 10 of 2026, it's hitting 48.67 percent.
Do more turnovers mean the NFL game goes over?
No. Games with over 2.5 turnovers went over the total 48.02 percent of the time, and games with under 2.5 went over 49.89 percent. The correlation between turnovers and how far a game finished from its total was 0.008, which is essentially none.
Is a turnover prop and the game under a correlated parlay?
Not in a meaningful way. Over 2.5 turnovers and the game under hit together 25.63 percent of the time from 2016 through 2025. If the two were unrelated, you'd expect 25.16 percent. Price each leg on its own.
How often do NFL favorites win when they don't turn the ball over?
Favorites with zero turnovers won 84.64 percent of the time and covered 68.11 percent from 2016 through 2025, across 853 games. A favorite with two turnovers won 50.10 percent and covered 32.06 percent.
Are NFL turnovers going down?
Yes. Games averaged 2.74 turnovers from 2016 through 2019, 2.60 from 2020 through 2022 and 2.47 from 2023 through 2025. The 2025 season averaged 2.31, the lowest in the study. 2026 is back at 2.60 through Week 10.
How do first-half turnovers affect the full-game turnover prop?
A lot. When the first half had no turnovers, the game finished over 2.5 only 16.28 percent of the time. One first-half turnover pushed it to 42.92 percent, and two pushed it to 77.28 percent. First halves held 45.82 percent of all turnovers.
The Best Bet on Sports · 1.5M followers on TikTok
Sports Betting TikTok is the live betting account behind The Best Bet on Sports, covering NFL, NCAAF, NBA, NCAAB, MLB and WNBA markets in real time. The account has been limited on all six major U.S. sportsbooks — FanDuel, DraftKings, Caesars, BetMGM, Fanatics and ESPN BET — for winning on live betting, with $367,520 in verified profit since 2005. View full profile →
Past results do not guarantee future performance. Must be 21 or older to wager.
Related Articles
NFL Total Touchdowns Prop: How Many TDs a Game Really Has
NFL Opening-Drive Touchdown Prop: How Often It Really Hits
NFL Week 1 Parlay Strategy: The Hidden Correlation
NFL Over/Under After a Shootout: 27 Years Tested
NFL Score Before Halftime Prop: The Final 2 Minutes Tested
Both NFL Teams to Score 20+: How Often It Hits
Get real live betting picks
From $39.95/mo · Cancel anytime · Email + Discord delivery
● Get The Picks
Choose your package
Tap any tier below to select · Subscribe in one tap
👇 Tap any package to select it
✓ You're selecting
25 Units · $99.95/month
25 unit picks per month. Sweet spot for most bettors — plenty of action without going all-in.
- ✓25 live betting selections/month
- ✓Email + Discord delivery
- ✓All sports (NFL, NCAAF, NBA, NCAAB, MLB)
- ✓Mix of 1, 2, 3, 5-unit rated plays
- ✓Cancel anytime
Secure PayPal · Cancel anytime · No hidden fees · 21+ · +$367K verified
+$367,520 verified · Limited on 6 sportsbooks · 20 years documented · See Proof
Join Our Newsletter
Get free expert sports picks and analysis delivered weekly.