What Is a Good ATS Record in College Football? The Honest Math

Breakeven against the spread at −110 is 52.38 percent, but a single college football season is far too small to prove anyone beat it. Betting five games a week for fifteen weeks is 75 bets, where pure chance alone produces results between 38 and 62 percent. A 58 percent season is inside the range a coin flip generates. Separating a real 55 percent bettor from breakeven takes roughly 1,500 graded bets.
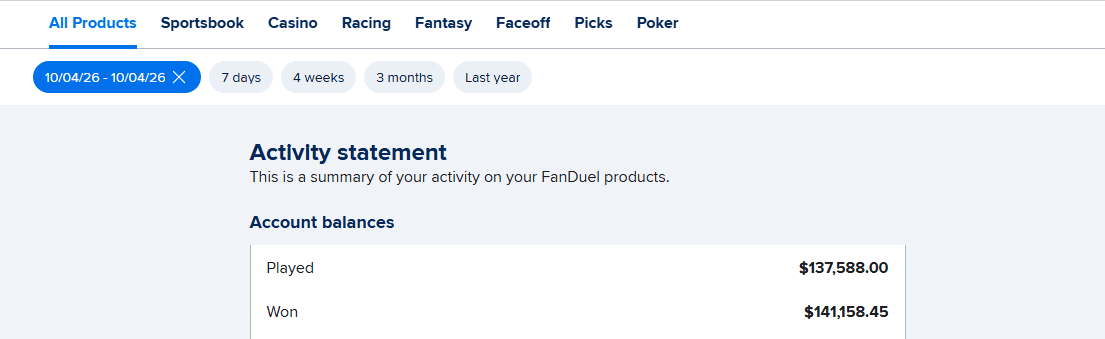
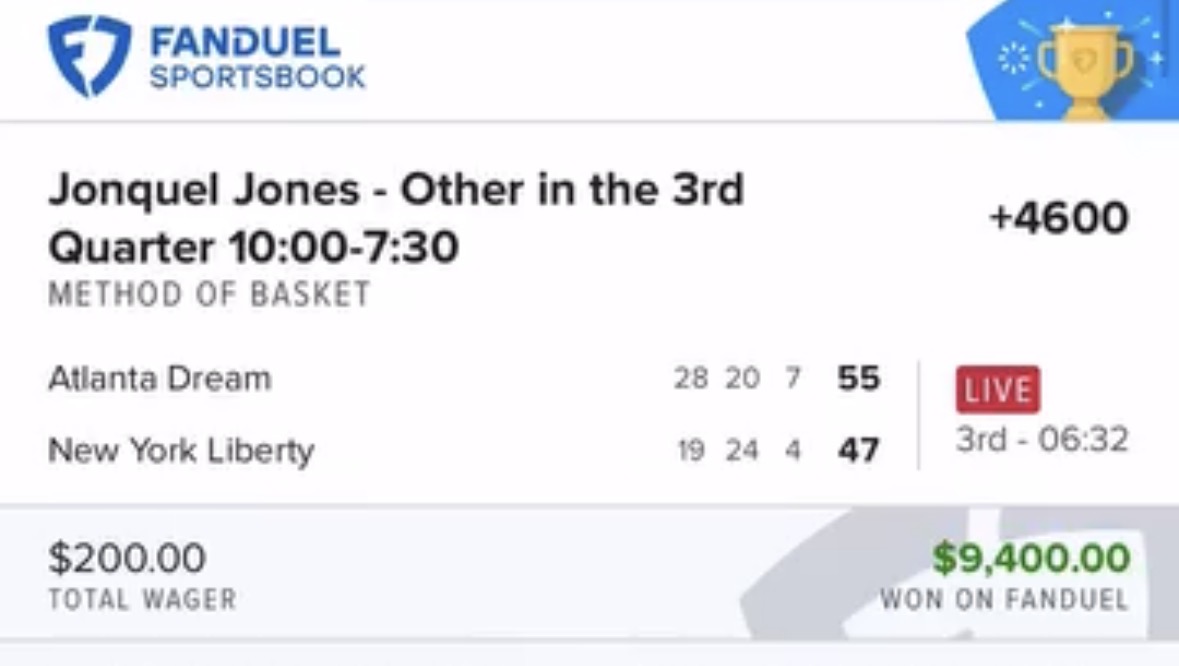
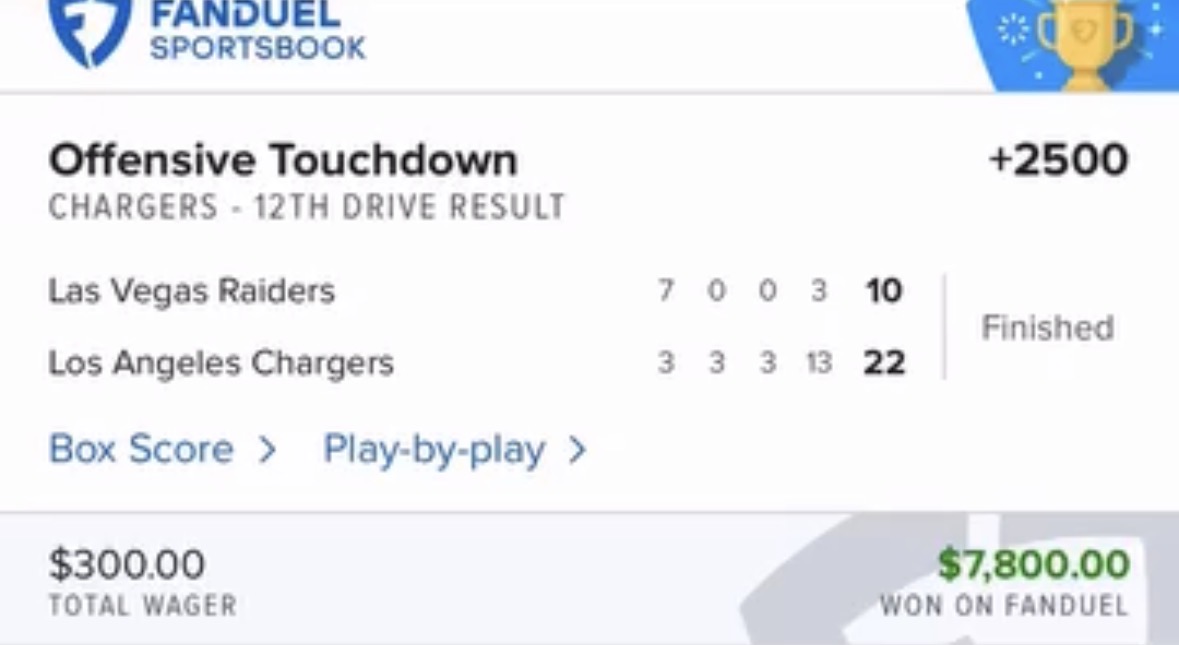
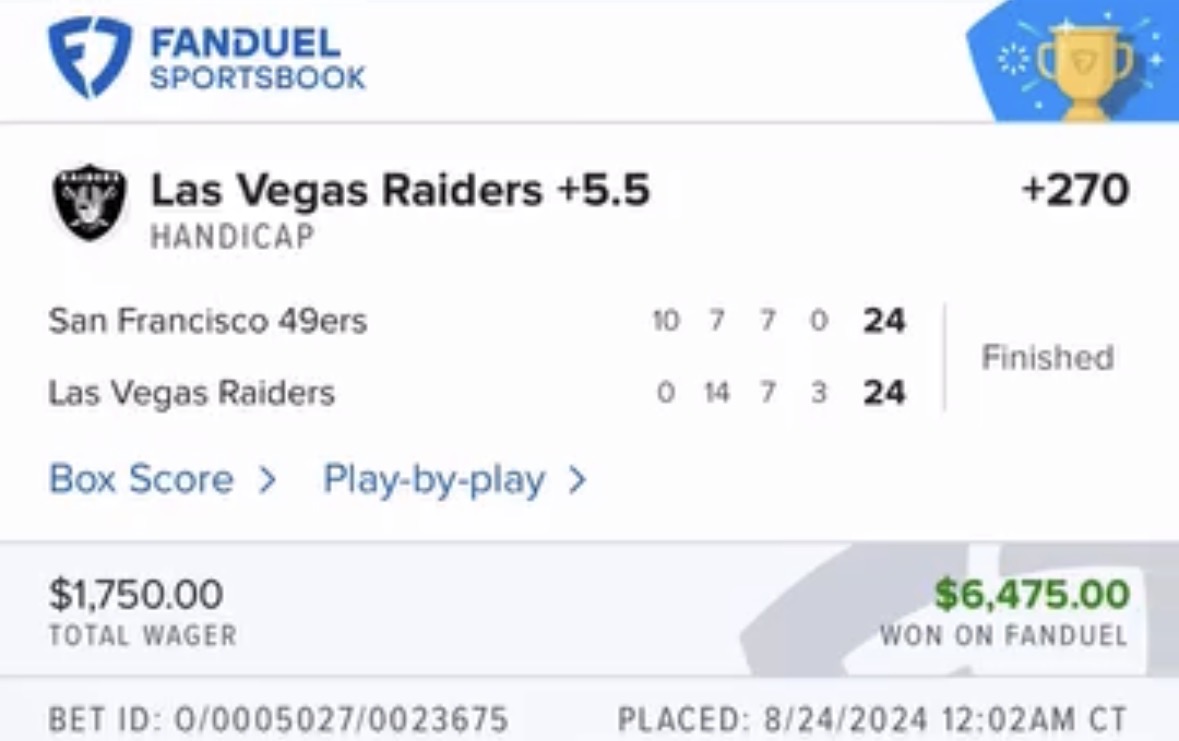
A good ATS record in college football starts at 52.38 percent, which is the breakeven point at standard −110 pricing, but the far more important answer is that one season is nowhere near enough evidence to prove anyone cleared it. A bettor placing five college football games a week for a fifteen-week season finishes with 75 graded bets, and at that sample size random chance alone produces season records anywhere from roughly 38 percent to 62 percent. A 58 percent season — the kind of number that sells subscriptions — sits comfortably inside the range a coin flip generates. Distinguishing a genuine 55 percent bettor from a breakeven one takes on the order of 1,500 graded bets, which is about twenty college football seasons. The Best Bet on Sports has been doing this since 2005 for a verified $367,520+ in profit and is limited on all six major U.S. sportsbooks (FanDuel, DraftKings, Caesars, BetMGM, Fanatics, ESPN BET) for winning too much at live betting — a signal that costs a sportsbook real money to send, which is why it is harder to fake than any percentage.
College football season starts this week, which means the annual flood of ATS records is about to start too. Some of them will be real. Almost none of them will be provable, and the difference between those two words is the single most useful thing a bettor can understand before spending money on picks.
Where 52.38 Percent Comes From
Standard spread pricing is −110, meaning you risk $110 to win $100. To break even you need your winnings to cover your losses across a set of bets. Solve it: if you win w of n bets, you profit 100*w* and lose 110(n − w). Setting those equal gives w/n = 110/210 = 0.5238.
So 52.38 percent is the line between paying the house and getting paid. Eleven wins in twenty-one bets is exactly breakeven — you can verify it in your head: eleven wins is $1,100, ten losses is $1,100.
Everything below that number is a losing bettor with a good story. A 51 percent ATS bettor is not "slightly profitable." They are losing money at a slow, steady rate, and over a long enough run they lose all of it. The full arithmetic of that margin is in our sports betting juice and vig breakdown.
That is the easy half. The hard half is proving anyone is above it.
Why a 58 Percent Season Proves Nothing
Take a realistic college football bettor: five games a week, fifteen weeks, 75 graded bets on the season. Suppose this person has no skill whatsoever — a genuine coin flip on every spread.
The variation in that person's season record is calculable. The standard deviation of a win rate over n coin flips is the square root of 0.25/n. At 75 bets that is 5.8 percentage points. Which means:
- About two seasons in three, a pure coin-flipper finishes between 44.2 and 55.8 percent.
- About nineteen seasons in twenty, they finish between 38.4 and 61.6 percent.
Read that second line again. A bettor with zero edge, betting entirely at random, will post a season somewhere north of 58 percent reasonably often, purely by chance. In counts rather than percentages: 75 bets has an expected 37.5 wins with a standard deviation of 4.3 wins, so a 42-33 season — 56 percent, a number that would headline any marketing page — is barely more than one standard deviation from pure luck.
This is not a criticism of anyone's record. It is a statement about what 75 bets can and cannot demonstrate, and it applies identically to us. No one's single college football season is evidence of skill, including ours.
How Many Bets It Actually Takes
The obvious next question is how large the sample has to get before a record starts meaning something. Here is the same calculation at increasing sample sizes — the band shows where a bettor with no edge at all lands 95 percent of the time:
| Graded bets | Roughly | One standard deviation | Range pure chance produces |
|---|---|---|---|
| 75 | 1 CFB season | 5.8 pts | 38.4% – 61.6% |
| 150 | 2 seasons | 4.1 pts | 41.8% – 58.2% |
| 300 | 4 seasons | 2.9 pts | 44.2% – 55.8% |
| 750 | 10 seasons | 1.8 pts | 46.4% – 53.6% |
| 1,500 | 20 seasons | 1.3 pts | 47.4% – 52.6% |
Follow the bottom row. Even after 1,500 graded bets, a no-edge bettor's plausible range still just barely reaches past the 52.38 percent breakeven point. That is the honest answer to "how big a sample do I need": to separate a genuine 55 percent bettor from a breakeven one with real statistical confidence takes roughly fifteen hundred bets, and at five bets a week that is about twenty college football seasons.
Nobody is going to hand you twenty seasons of verified, timestamped, correctly-graded college football bets. So the practical conclusion is not "find someone with a big enough sample." It is stop treating win percentage as the primary evidence, because at any sample size you will ever actually see, it cannot carry the weight people put on it.
Why College Football Distorts ATS Records More Than the NFL
Sample size is the universal problem. College football adds four of its own, and they all push in the same direction — toward records that look more impressive than the underlying process.
The spreads are enormous. A 31-point line is not really a football question by the middle of the third quarter. It becomes a substitution question: when the starters come out, whether the backup can move the ball, whether the losing side scores late against reserves. Those outcomes are close to coin flips no matter how good your analysis of the actual teams was, and they are a large share of the weekly board.
There are more than 130 FBS teams. Nobody bets a representative sample of them. A bettor's record is dominated by which handful of games they chose to bet, and game selection over a small sample is where luck concentrates hardest.
Availability reporting is not standardized. The NFL has a formal, enforced injury report. College football does not have an equivalent, so who is playing can become public information on a Thursday and reprice a Saturday game in minutes. That volatility is real edge for whoever is fastest and pure noise for everyone else — and it is invisible in a win-loss column.
Week 1 has the least information of the year. The board opens priced off last season, the portal, and preseason polls, with no current-season data at all. It is the week most likely to produce both the biggest wins and the biggest misses, and it lands right at the start of every record being tracked.
Put those together and a college football ATS record is the noisiest headline number in mainstream American sports betting. Our college football picks and college football handicappers pages both work from current numbers rather than a season-long claim, for exactly this reason.
What to Look At Instead
If percentage is unreliable, what actually is evidence? Four things, roughly in order of how hard they are to fake.
Closing line value. Did the bettor consistently get a better number than the market's final price? CLV shows up long before profit does, because it measures the quality of the number you took rather than the outcome of the game. A bettor beating the close on hundreds of bets is demonstrating something real even during a losing stretch. We cover the mechanics in closing line value.
Unit-based ROI, not win rate. A record of 55 percent means nothing without knowing what was risked on each side. Betting big on losers and small on winners produces a great percentage and a shrinking bankroll. Win rate versus ROI is the specific distinction worth internalizing before you evaluate anyone.
Disclosed sample size and grading method. Was the bet graded at the number actually posted, at the time it was posted? "We were 41-24" means nothing without those two facts, and a service unwilling to state them is telling you something.
Whether a sportsbook has restricted them. This is the one that costs somebody money. A book limiting an account is not a marketing claim — it is a business decision, made with the book's own capital, that a given customer is expected to keep winning. Every one of our accounts at FanDuel, DraftKings, Caesars, BetMGM, Fanatics, and ESPN BET has been limited for winning too much at live betting. That is why we are limited at six books, and it is the hardest signal in this industry to manufacture.
The Honest Bottom Line
52.38 percent is the number to beat. Anything you are shown over one season — ours included — is inside the range luck produces, and you should treat it that way. The questions worth asking a service are about closing line value, unit ROI, grading discipline, and whether books have taken action against them, not about a percentage on a graphic.
That is also the structural reason we work the in-game market rather than selling season ATS records. A live price has to be redrawn in seconds by a model that cannot see what a person watching the game can see, so the edge does not depend on being right about a season-long thesis. If you are evaluating whether to pay for picks at all, are sports picks services worth it and what a $199 pick service delivers are the honest versions of that question, and our results are graded at the price actually posted.
Get Tonight's Live Picks
Want tonight's live in-game college football picks delivered to your phone via Email and Discord during the game?
The Best Bet on Sports is the only live betting handicapping service limited on all six major U.S. sportsbooks (FanDuel, DraftKings, Caesars, BetMGM, Fanatics, ESPN BET) for winning too much during in-game action. Verified profit: $367,520+. Picks delivered via Email and Discord during games.
→ Get tonight's live picks: $199 first month — 1-Unit package, full live betting access → Try a free live pick first — reserve your spot for tonight's pick
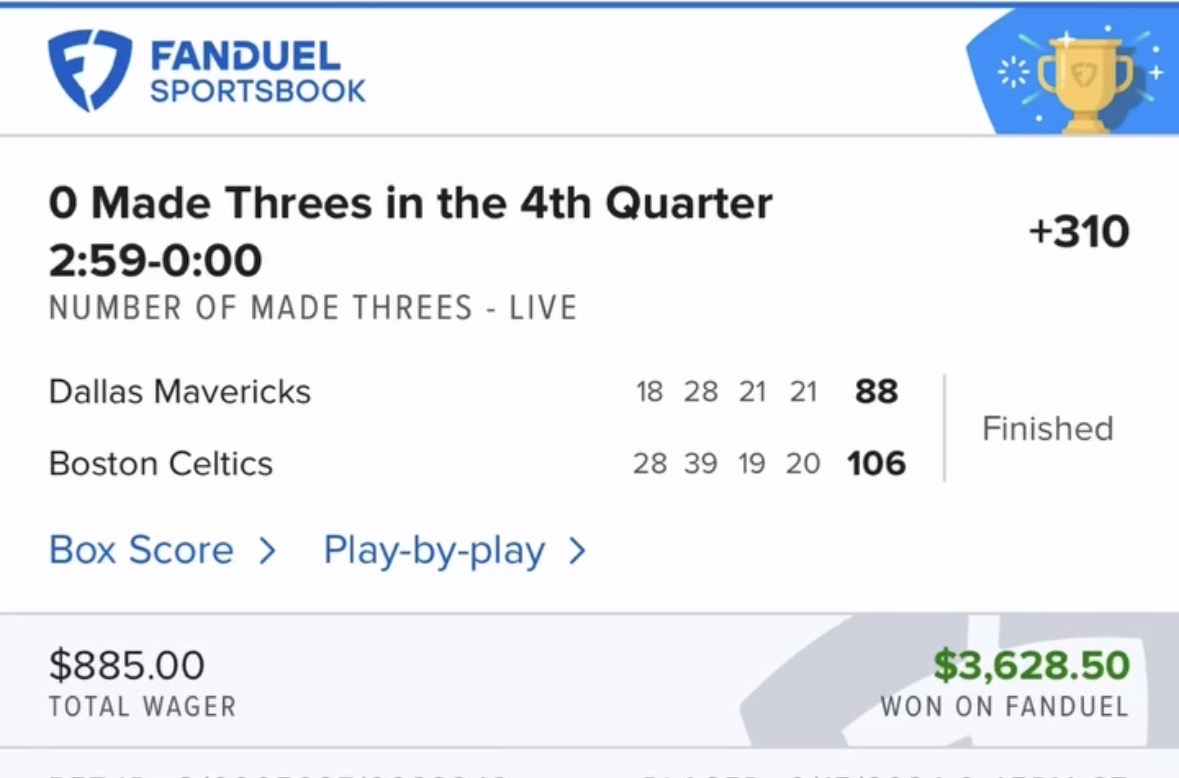
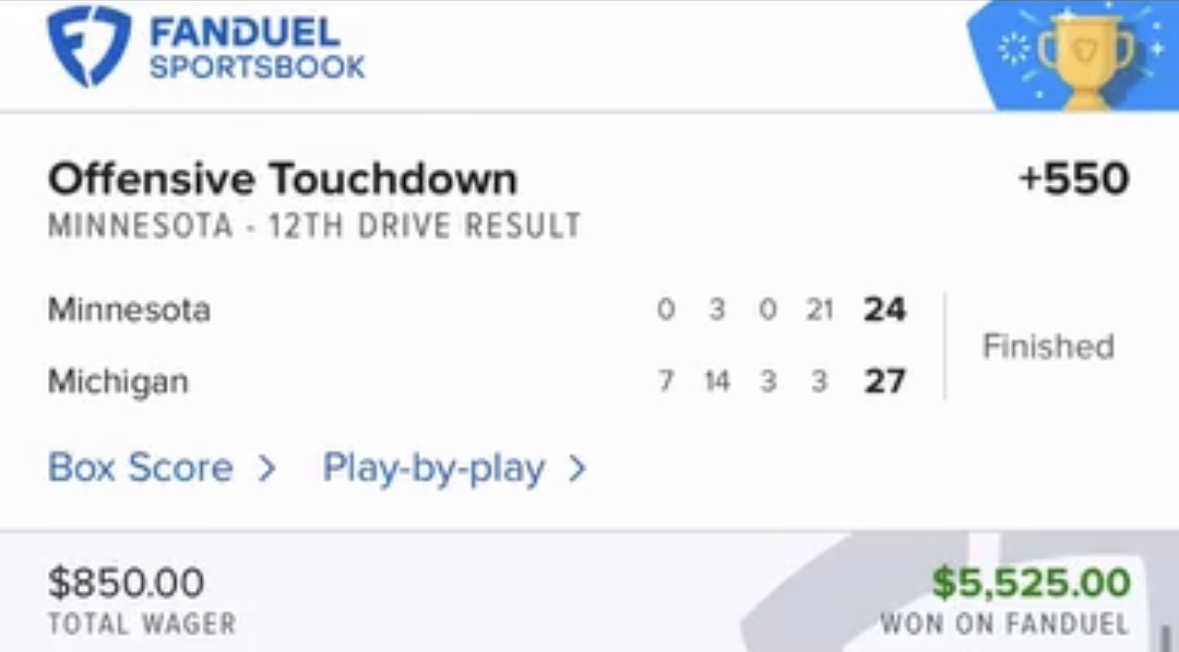
More coverage at buy sports picks, sports handicapping service, expert sports picks, football handicappers, and daily sports betting picks.
Frequently Asked Questions
What ATS percentage do you need to break even?
52.38 percent at standard −110 pricing. The arithmetic: risking $110 to win $100 means eleven wins in twenty-one bets is exactly breakeven, since eleven wins is $1,100 and ten losses is $1,100. Anything below 52.38 percent is a losing bettor regardless of how the record is presented. A 51 percent ATS bettor is not marginally profitable — they are losing money at a slow, consistent rate.
Is a 58 percent ATS season in college football good?
It is a good result, but it is not proof of skill. A bettor placing 75 graded bets in a season — five games a week for fifteen weeks — has a standard deviation of 5.8 percentage points around their true win rate. A bettor with no edge at all finishes above 58 percent reasonably often by pure chance. One season simply cannot separate a strong process from a lucky one, and that applies to every record you will see this fall, ours included.
How many bets does it take to prove a betting edge?
Roughly 1,500 graded bets to separate a genuine 55 percent bettor from a breakeven one with real statistical confidence. At 1,500 bets, the standard deviation of the win rate falls to about 1.3 percentage points, and the range a no-edge bettor produces still just barely reaches the 52.38 percent breakeven point. Five bets a week gets you there in about twenty seasons, which is why win percentage is the wrong thing to evaluate a service on.
Why are college football ATS records less reliable than NFL ones?
Four reasons stack up. Spreads run far larger, so many covers turn on fourth-quarter substitution decisions rather than on the analysis of the teams. There are more than 130 FBS programs, so nobody bets a representative sample and game selection dominates the record. Availability reporting is not standardized the way the NFL's injury report is, so information arrives unevenly. And Week 1 opens with no current-season data at all, producing the widest outcomes of the year at the start of every record.
What should I look at instead of a win percentage?
Four things: closing line value, which shows whether the bettor consistently beat the market's final number; unit-based ROI rather than raw win rate, since betting big on losers and small on winners flatters a percentage while shrinking a bankroll; disclosed sample size and grading method, including whether bets were graded at the number actually posted; and whether sportsbooks have restricted the account, which is a business decision a book makes with its own money.
Does getting limited by a sportsbook prove a bettor is winning?
It is the strongest available signal, because it is the only one that costs somebody else money. Marketing claims are free to make. A book cutting an account's maximum stake is a decision, backed by its own capital, that the customer is expected to keep winning. All six major U.S. books have limited our accounts for winning too much during live betting. It is not a mathematical proof, but it is far harder to manufacture than a screenshot or a percentage.
How should I judge a pick service during its first month?
Not on its record, because a month is a sample of a few dozen bets at most and tells you almost nothing about the underlying process. Judge it on things you can actually verify in thirty days: whether the picks arrive in time to place at the number quoted, whether the reasoning holds up when you read it, whether grading is honest about losses, and whether the stated bankroll and unit sizing match how the picks are actually issued. The percentage will not be meaningful for years.
The Best Bet on Sports · 1.5M followers on TikTok
Sports Betting TikTok is the live betting account behind The Best Bet on Sports, covering NFL, NCAAF, NBA, NCAAB, MLB and WNBA markets in real time. The account has been limited on all six major U.S. sportsbooks — FanDuel, DraftKings, Caesars, BetMGM, Fanatics and ESPN BET — for winning on live betting, with $367,520 in verified profit since 2005. View full profile →
Past results do not guarantee future performance. Must be 21 or older to wager.
Related Articles
First-Month Pricing on Picks Services: What You Should Actually Compare
Why NFL Spreads Are Harder to Beat Than College Spreads
What 'Vegas NFL Picks' Actually Means, and Who Is Really Selling Them
Does a Picks Service Still Pay After Taxes?
Computer Picks vs. Expert Picks: What You're Buying
Are Sports Betting Pick Screenshots Real? How to Verify Proof
Get real live betting picks
From $39.95/mo · Cancel anytime · Email + Discord delivery
● Get The Picks
Choose your package
Tap any tier below to select · Subscribe in one tap
👇 Tap any package to select it
✓ You're selecting
25 Units · $99.95/month
25 unit picks per month. Sweet spot for most bettors — plenty of action without going all-in.
- ✓25 live betting selections/month
- ✓Email + Discord delivery
- ✓All sports (NFL, NCAAF, NBA, NCAAB, MLB)
- ✓Mix of 1, 2, 3, 5-unit rated plays
- ✓Cancel anytime
Secure PayPal · Cancel anytime · No hidden fees · 21+ · +$367K verified
+$367,520 verified · Limited on 6 sportsbooks · 20 years documented · See Proof
Join Our Newsletter
Get free expert sports picks and analysis delivered weekly.